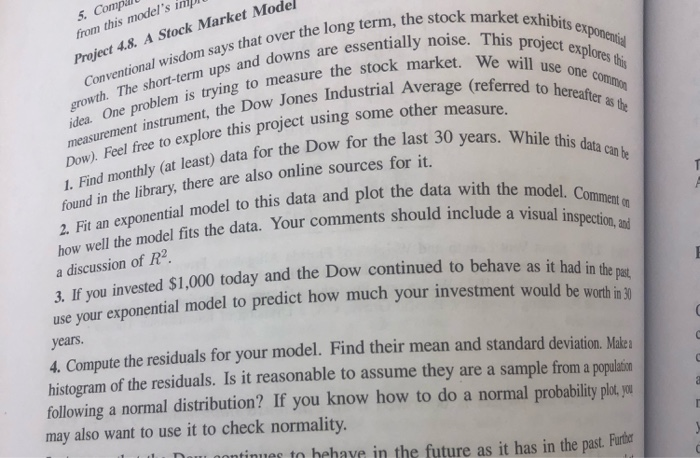
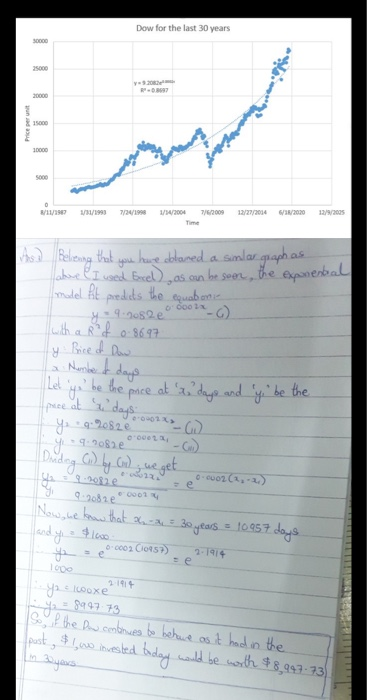
5. Compil from this model's int Project 4.8. A Stock Market Model et exhibits exponential This project explores this will use one common red to hereafter as the Conventional wisdom says that over the long term growth. The short-term ups and downs are idea. One problem is trying to measure the measurement instrument, the Dow Jones Industrial A Dow). Feel free to explore this project using some other 1. Find monthly (at least) data for the Dow for ong term, the stock market exhibits downs are essentially noise. This proi measure the stock market. We will dustrial Average (referred to here act using some other measure. ata for the Dow for the last 30 years. While thi While this data can be the data with the model. Comment ts should include a visual inspection, and found in the library, there are also online sources for it. 2. Fit an exponential model to this data and plot the data w how well the model fits the data. Your comments should includ a discussion of R2 inued to behave as it had in the past, 2. If you invested $1,000 today and the Dow continued to behave a ur exponential model to predict how much your investment would be years. 4. Compute the residuals for your model. Find their mean and standard deviation. Makes histogram of the residuals. Is it reasonable to assume they are a sample from a population following a normal distribution? If you know how to do a normal probability plot, you may also want to use it to check normality. L . Nam anntinues to behave in the future as it has in the past. Fur Only! Dow for the last 30 years 3/11/2987 3 1/1993 7/24/1998 1/24/2006 7/6/2009 12/27/2014 //2020 12/9/2005 Belrening that you have oblaned a simlar graph as above I used becel), as can be soon, the exponental model At predicts the equabon y=9.208220022-) with a Ref 0-8697 y Price of Dow La Number of days Let yo be the pace at a days and 'y be the puce at 2 days yo9-2082 y 9.9082 e - Dindag (;) by Cn); we get EO-C002 (2,-2) 9 : 2032 2001 Now she know that a -2 = 30 years = 10957 days 2.1914 and y = $1000 - 0.0002 C0957) 1000 I ya Looxe 2.1919 = $99773 Ise of the Dow continues to behave as it had in the post, $1,0w invested today would be with $8,947-73) m2 5. Compil from this model's int Project 4.8. A Stock Market Model et exhibits exponential This project explores this will use one common red to hereafter as the Conventional wisdom says that over the long term growth. The short-term ups and downs are idea. One problem is trying to measure the measurement instrument, the Dow Jones Industrial A Dow). Feel free to explore this project using some other 1. Find monthly (at least) data for the Dow for ong term, the stock market exhibits downs are essentially noise. This proi measure the stock market. We will dustrial Average (referred to here act using some other measure. ata for the Dow for the last 30 years. While thi While this data can be the data with the model. Comment ts should include a visual inspection, and found in the library, there are also online sources for it. 2. Fit an exponential model to this data and plot the data w how well the model fits the data. Your comments should includ a discussion of R2 inued to behave as it had in the past, 2. If you invested $1,000 today and the Dow continued to behave a ur exponential model to predict how much your investment would be years. 4. Compute the residuals for your model. Find their mean and standard deviation. Makes histogram of the residuals. Is it reasonable to assume they are a sample from a population following a normal distribution? If you know how to do a normal probability plot, you may also want to use it to check normality. L . Nam anntinues to behave in the future as it has in the past. Fur Only! Dow for the last 30 years 3/11/2987 3 1/1993 7/24/1998 1/24/2006 7/6/2009 12/27/2014 //2020 12/9/2005 Belrening that you have oblaned a simlar graph as above I used becel), as can be soon, the exponental model At predicts the equabon y=9.208220022-) with a Ref 0-8697 y Price of Dow La Number of days Let yo be the pace at a days and 'y be the puce at 2 days yo9-2082 y 9.9082 e - Dindag (;) by Cn); we get EO-C002 (2,-2) 9 : 2032 2001 Now she know that a -2 = 30 years = 10957 days 2.1914 and y = $1000 - 0.0002 C0957) 1000 I ya Looxe 2.1919 = $99773 Ise of the Dow continues to behave as it had in the post, $1,0w invested today would be with $8,947-73) m2


