Question
5. Compute Return on Assets: (%) ________________% Explain what this means: 6. What is Return on Equity (in %) ? ________________% Explain what this means:


5. Compute Return on Assets: (%)
________________%
Explain what this means:
6. What is Return on Equity (in %)?
________________%
Explain what this means:
7. What is the Operating Profit Margin Ratio?
%
Explain what this means:
8. Compute the Asset Turnover Ratio which is Total Revenue divided by Total (Avg.) Assets. What does this value mean? How do you interpret it?
(Additional Questions that would really help me out if you answered them) 9. From the Income Statement, how much did Joe Farmer's equity (i.e. retained farm earnings) increase or decrease during 2018? $ _____________
10. What was Joe Farmer.'s equity on January 1, 2018?
11. Value of Farm Production is a concept defined as Total Revenue minus livestock purchased minus feed purchased. What was Joe's Value of Farm Production for 2018?
12. What does the Value of Farm Production Measure?
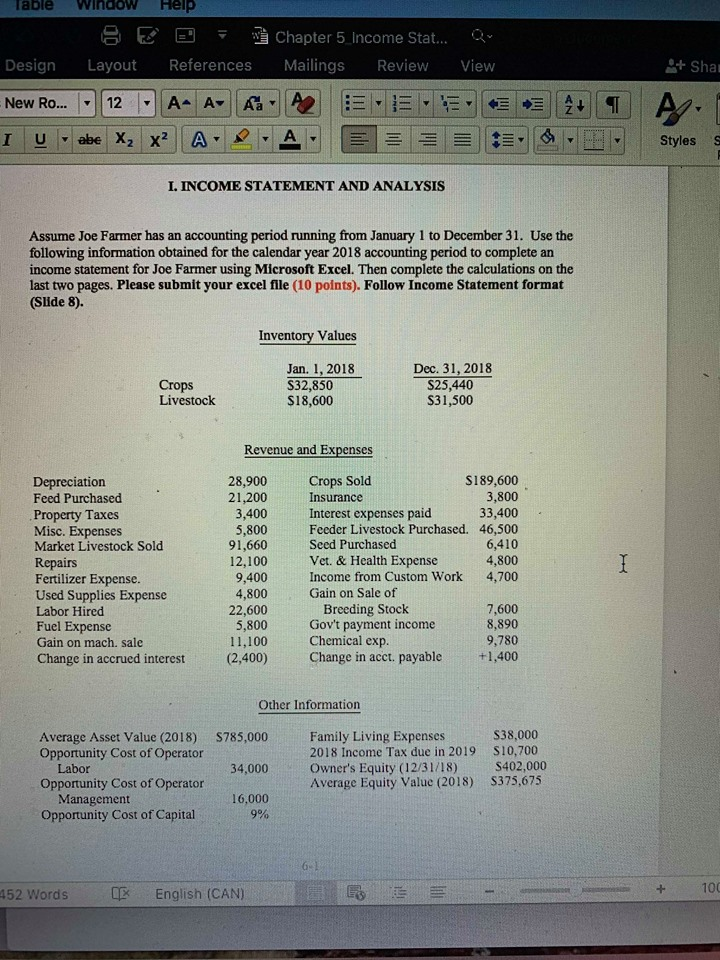
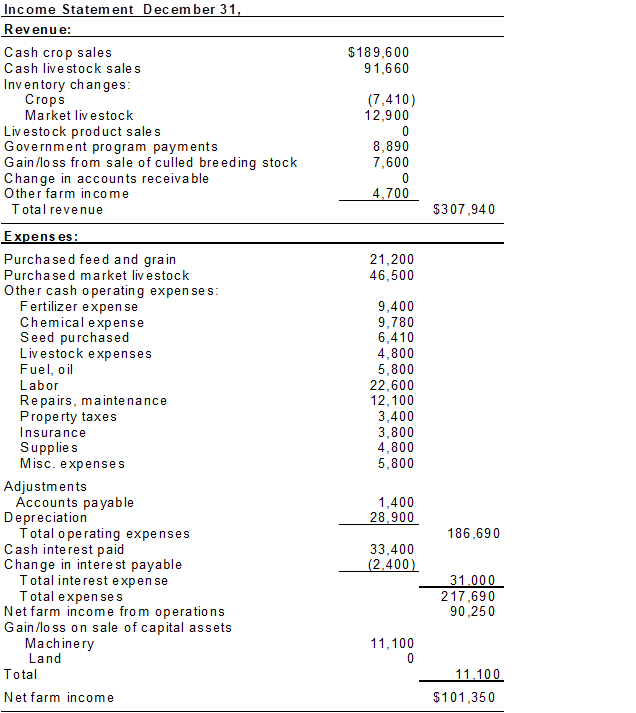
ableWindoW Help Chapter 5 Income Stat.... Design Layout References Mailings Review View Shai New Ro... 12 A A Styles S I. INCOME STATEMENT AND ANALYSIS Assume Joe Farmer has an accounting period running from January 1 to December 31. Use the following information obtained for the calendar year 2018 accounting period to complete an income statement for Joe Farmer using Microsoft Excel. Then complete the calculations on the last two pages. Please submit your excel fille (10 points). Follow Income Statement format (Slide 8). Inventory Values Crops Livestock Jan. 1, 2018 S32,850 $18,600 Dec. 31, 2018 $25,440 S31,500 Revenue and Expenses Depreciation Feed Purchased Property Taxes Misc. Expenses Market Livestock Sold Repairs Fertilizer Expense. Used Supplies Expense Labor Hired Fuel Expense Gain on mach. sale Change in accrued interest $189,600 3,800 33,400 Feeder Livestock Purchased. 46,500 6,410 4,800 Income from Custom Work 4,700 28,900 Crops Sold 21,200Insurance 3,400Interest expenses paid 5,800 91,660 12,100 9,400 4,800 22,600 5,800 11,100 (2,400) Seed Purchased Vet. & Health Expense Gain on Sale of Breeding Stock Gov't payment income Chemical exp. Change in acct. payable 7,600 8,890 9,780 +1,400 Other Information S785,000Family Living ExpensesS38,000 2018 Income Tax due in 2019 S10,700 Owner's Equity (12/31/18)$402,000 Average Equity Value (2018) S375,675 Average Asset Value (2018) Opportunity Cost of Operator Labor 34,000 Opportunity Cost of Operator 16,000 9% Management Opportunity Cost of Capital 100 452 Words English (CAN) Income Statement December 31 Revenue Cash crop sales Cash live stock sale s Inventory changes $189,600 91,660 (7,410) 12,900 Crops Market livestock Livestock product sales Governme nt program payments Gain/lo ss from sale of culled bre eding stock Change in accounts receiva ble Other farm in come 8,890 7,600 4700 T otal revenue $307,940 Expens es Purchased feed and grain Purchased market livestock Other cash operating expenses 21,200 46,500 Fertilizer expense Chemical expense Seed purchased Livestock expenses Fuel, oil Labor Re pairs, maintenance Property taxes Insurance Supplie s Misc. expenses 9,400 9,780 6,410 4,800 5,800 22,600 12,100 3,400 3,800 4,800 5,800 Adjustments Depreciation Cash interest paid 1,400 28.900 Accounts payable 2086,690 Total operating expenses 33,400 2.400 Change in intere st payable Total interest expen se Total expen ses 217,690 90,250 Net farm income from operations Gain/loss on sale of capital assets 11,100 Machinery Land Total Net farm income $101,350Step by Step Solution
There are 3 Steps involved in it
Step: 1

Get Instant Access to Expert-Tailored Solutions
See step-by-step solutions with expert insights and AI powered tools for academic success
Step: 2

Step: 3

Ace Your Homework with AI
Get the answers you need in no time with our AI-driven, step-by-step assistance
Get Started


