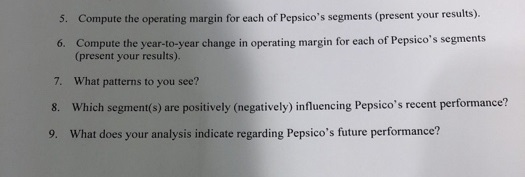
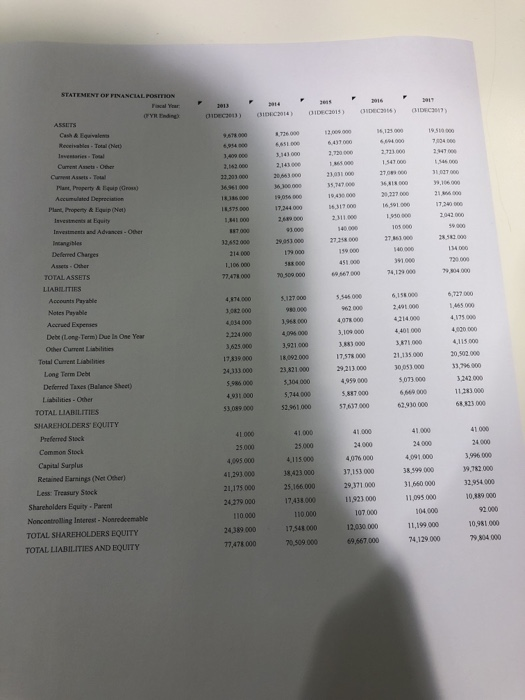
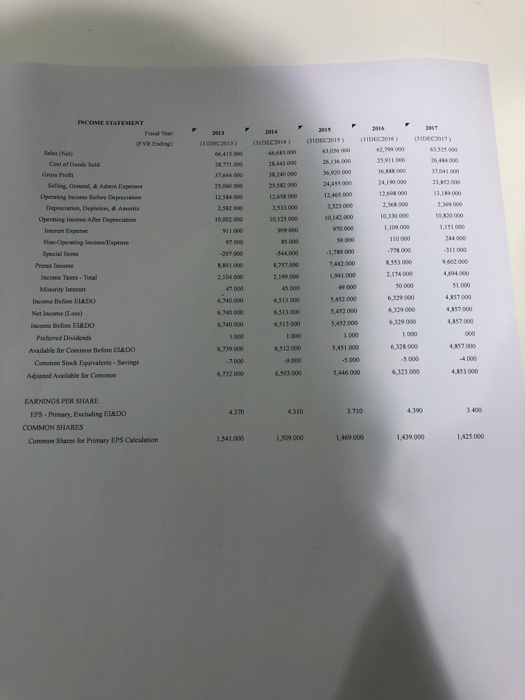
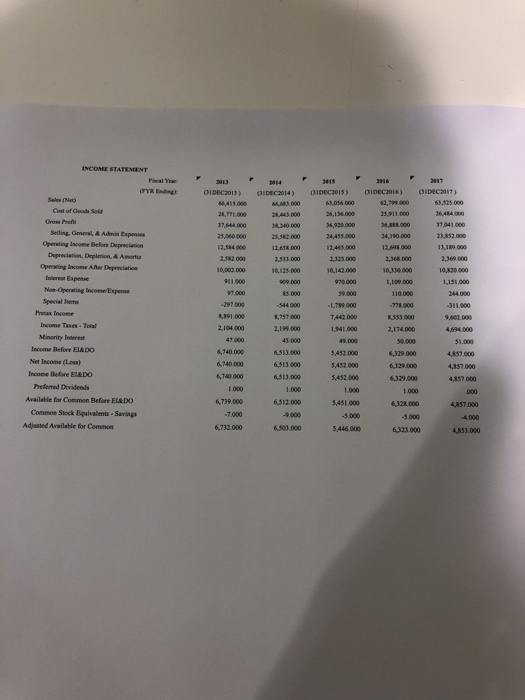
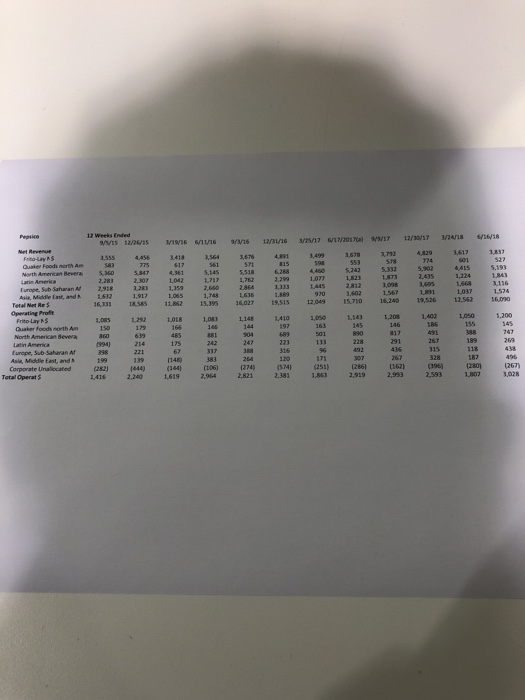
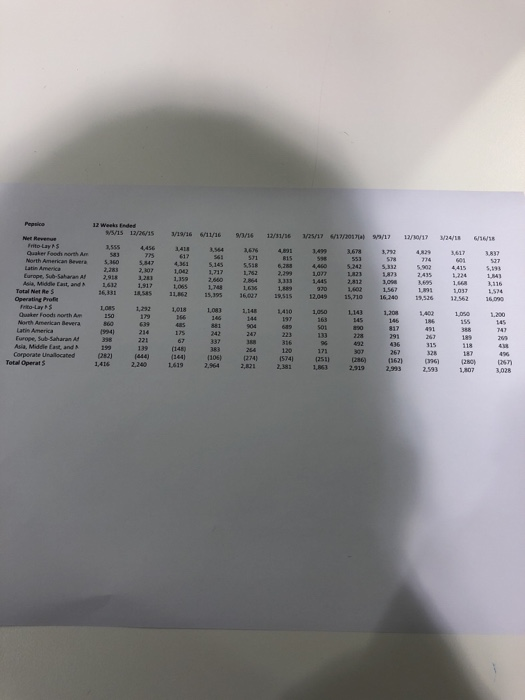
5. Compute the operating margin for each of Pepsico's segments (present your results). 6. Compute the year-to-year change in operating margin for each of Pepsico's segments (present your results). 7. What patterns to you see? 8. Which segment(s) are positively (negatively) influencing Pepsico's recent performance? 9. What does your analysis indicate regarding Pepsico's future performance? ,736 0002,00000 6,125 0001951 000 2723 000 Plant, Property& Equip (Gross) 6961 0006 300 000 ,747 00 6,81 000,106 000 Plant, Property & Equip (Net) 575 000 17,244006,317 000 Investment at Equity 32,652000293530000 27 86100 Deferred Charges 77,478 000 0 509.000 4,874,000 noo ss-6000 6..000 2,491.000 6727000 1,465 000 Accrued Expenses Deb(Long-Term) Due 1, One Year 1,968 000 4,09% 000 4,078 000 3,109 000 2,224.000 Total Current Liabilnies 17,578 000 21,135 000 0,502 000 33,796 000 Long Term Debt Deferred Taxes (Balance Sheet) 23,821000 5,986 000 4931 000 53,089 000 5,073.000 689 000 5,744 000 11283000 SHAREHOLDERS EQUITY 41000 41.000 24000 3,996 000 39,782 000 4,095 000 4,076 000 37,153 000 25,16600029,371000 11,923 000 4.091.000 38,599 000 160 000 Retained Earnings (Net Oher) 18,423 000 21,175 000 Less: Treasury Saock Shareholders Equity Parent 0,889000 110000 0,981000 TOTAL SHAREHOLDERS EQUITY TOTAL LIABILITIES AND EQUITY 24,389 000 70,309.000 7412900780400 (F YR Ending) OIDEczo13) Sales (Net) 2,99 000 26,136 00 36,920 000 Seling, Genaral, & Advin Expenses Before Deprecistion Deprociation, Depletion & Anonie Operating lacone 12,658 00012,465 000 2,368 000 10,330000 1,109 000 2,533000 Operatisg Income Afler Depreciation 10,002.000 244.000 Special Ihem 8,891 000 2,304 000 8,757 000 2,199000 7,442 000 1,941.000 8353 000 2,174 0 31.000 6,740 000 6,740 000 6,740 000 5,452 000 Iscome (ess) 6.513 000 6,513 000 5,452.000 Preferred Dividends Available for Common Before ELEDO 6,739 000 5,451000 -5 000 5,446 000 6,328 000 Common Stock Equivalents Savings Adjastod Available for Common 6,732 000 6,303000 6,323 000 EARNINGS PER SHARE EPS- Primary, Escluding El&DO COMMON SHARES 4 370 3.710 Common Shares for Primary EPS Calculation $41,000 1,509 0001,469000 1,439 1,425 000 STATEMENT 203 2014 2015 216 2017 Selling, Genoral & Admin Expenses Operating Iscone Before Depreciation Openaing income Afer Depreciation 9,602.000 ,104.000 5,740.000 6,740.000 Available for Common Before EI&DO 6,739.000 Common Stock Equivalents-Savings Adjasted Available for Common 6,732.000 555 4456 418 564 676 4891 3,499 1,678 5242 $,332 5,902 4415 5,193 1,6683,136 1,811,037 1,574 16 113 1S8S 11,862 15,356,027 19515 12,049 15,710 16,200 19,52612562 6090 10WS 1,292 1018 1,083 1,148 1,410 ,05041,201,403 1,0501,200 5,360 5,47 4,361 5,145 5518 6,288 4460 1,748 1,536 1.889 970 1,602 Asa,Midd,tnt,and retal Net Re Opwating Proffe LS32 1,917 1,065 furope, Sub Saharan Af Asia, Middle East, and Corporate unalocated 398 139 (444) 480 (144, c106) 76) (251) ize6) [162) Oo6) aa1 a671 (282) 1416 22 1,619 2.94 2821 2,381 1,862,9:9 2,993 2,593 Total Operat 5 4361 slas ssi8 0.288 4,460 5242 sm s502 4,415 s, 2,283 2,3071,042 Europe, Sub-Saharan A2981,281,359 Midde East, and 1,632 1.917 1,065 1,748 1,636 1 Lia 1,567 91 1.037 1,574 881 15 1162 5,395607 18515 12049 15,710 16240 15562 1609 LORS 1,292 1,018 LO83 1,148 0 1,060 LIA3 ,208 SAT 1,000 L200 Quaker Foods north Am150 Europe, Sub-Saharan A 38 (344) (306) (274) 1574) (251)26)(362) (28 ) 1416 2.2 1619 2,964 2,82 23811,8632,319 2993 1,807


