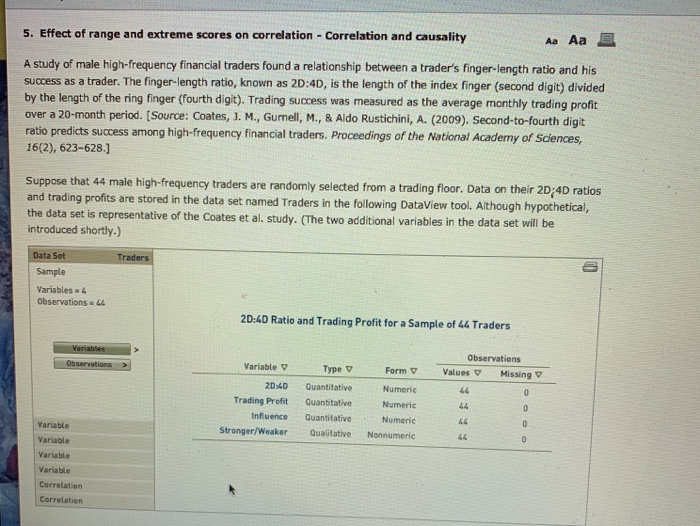
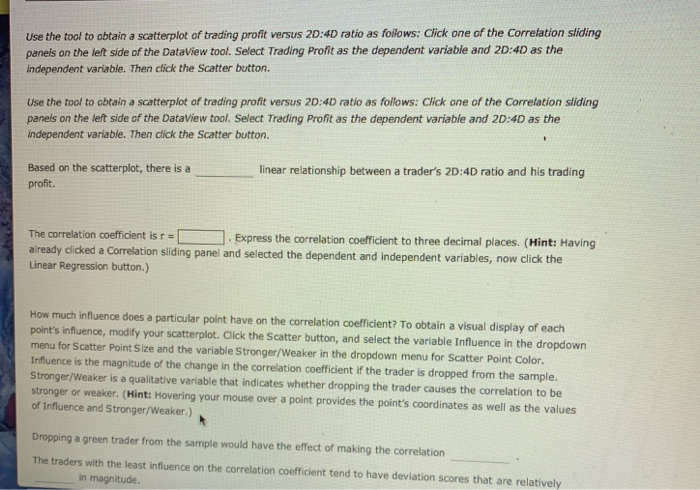
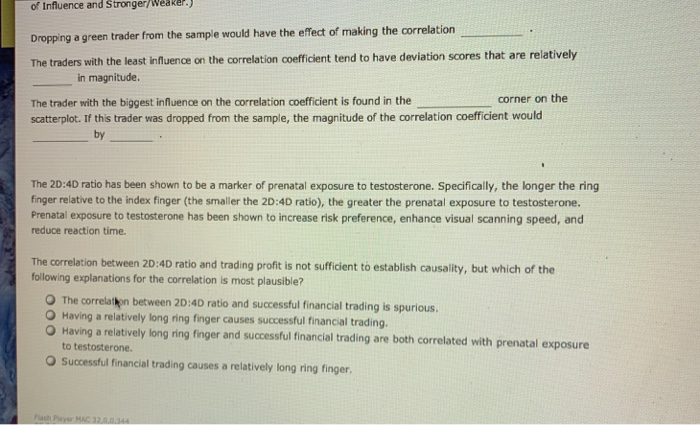
5. Effect of range and extreme scores on correlation - Correlation and causality Aa Aa E A study of male high-frequency financial traders found a relationship between a trader's finger-length ratio and his success as a trader. The finger-length ratio, known as 20:40, is the length of the index finger (second digit) divided by the length of the ring finger (fourth digit). Trading success was measured as the average monthly trading profit over a 20-month period. (Source: Coates, J. M., Gumell, M., & Aldo Rustichini, A. (2009). Second-to-fourth digit ratio predicts success among high-frequency financial traders. Proceedings of the National Academy of Sciences, 16(2), 623-628.] Suppose that 44 male high-frequency traders are randomly selected from a trading floor. Data on their 2D/4D ratios and trading profits are stored in the data set named Traders in the following DataView tool. Although hypothetical, the data set is representative of the Coates et al. study. (The two additional variables in the data set will be introduced shortly.) Traders Data Set Sample Variables 4 Observations LL 20:40 Ratio and Trading Profit for a Sample of 44 Traders Variables > Observations > Variable Type Observations Values Missing Form 20:40 Trading Profit Influence Stronger/Weaker Quantitative Quantitative Guantitative Qualitative Numeric Numeric Numeric Nonnumeric Variable Variable Variable Variable Correlation Correlation Use the tool to obtain a scatterplot of trading profit versus 20:40 ratio as follows: Click one of the Correlation sliding panels on the left side of the DataView tool. Select Trading Profit as the dependent variable and 20:40 as the Independent variable. Then dick the Scatter button. Use the tool to obtain a scatterplot of trading profit versus 20:40 ratio as follows: Click one of the Correlation sliding panels on the left side of the DataView tool. Select Trading Profit as the dependent variable and 20:4D as the independent variable. Then click the Scatter button. linear relationship between a trader's 2D:4D ratio and his trading Based on the scatterplot, there is a profit. The correlation coefficient isr Express the correlation coefficient to three decimal places. (Hint: Having already clicked a Correlation sliding panel and selected the dependent and independent variables, now click the Linear regression button.) How much influence does a particular point have on the correlation coefficient? To obtain a visual display of each point's influence, modify your scatterplot. Click the Scatter button, and select the variable influence in the dropdown menu for Scatter Point Size and the variable Stronger/Weaker in the dropdown menu for Scatter Point Color. Influence is the magnitude of the change in the correlation coefficient if the trader is dropped from the sample. Stronger/Weaker is a qualitative variable that indicates whether dropping the trader causes the correlation to be stronger or weaker. (Hint: Hovering your mouse over a point provides the point's coordinates as well as the values of Influence and Stronger/Weaker.) Dropping a green trader from the sample would have the effect of making the correlation The traders with the least influence on the correlation coefficient tend to have deviation scores that are relatively in magnitude of Influence and stronger/WeaRel. Dropping a green trader from the sample would have the effect of making the correlation The traders with the least influence on the correlation coefficient tend to have deviation scores that are relatively in magnitude. The trader with the biggest influence on the correlation coefficient is found in the corner on the scatterplot. If this trader was dropped from the sample, the magnitude of the correlation coefficient would by The 2D:4D ratio has been shown to be a marker of prenatal exposure to testosterone. Specifically, the longer the ring finger relative to the index finger (the smaller the 20:40 ratio), the greater the prenatal exposure to testosterone. Prenatal exposure to testosterone has been shown to increase risk preference, enhance visual scanning speed, and reduce reaction time. The correlation between 20:40 ratio and trading profit is not sufficient to establish causality, but which of the following explanations for the correlation is most plausible? The correlation between 20:40 ratio and successful financial trading is spurious. O Having a relatively long ring finger causes successful financial trading. Having a relatively long ring finger and successful financial trading are both correlated with prenatal exposure to testosterone. Successful financial trading causes a relatively long ring finger, Father 5. Effect of range and extreme scores on correlation - Correlation and causality Aa Aa E A study of male high-frequency financial traders found a relationship between a trader's finger-length ratio and his success as a trader. The finger-length ratio, known as 20:40, is the length of the index finger (second digit) divided by the length of the ring finger (fourth digit). Trading success was measured as the average monthly trading profit over a 20-month period. (Source: Coates, J. M., Gumell, M., & Aldo Rustichini, A. (2009). Second-to-fourth digit ratio predicts success among high-frequency financial traders. Proceedings of the National Academy of Sciences, 16(2), 623-628.] Suppose that 44 male high-frequency traders are randomly selected from a trading floor. Data on their 2D/4D ratios and trading profits are stored in the data set named Traders in the following DataView tool. Although hypothetical, the data set is representative of the Coates et al. study. (The two additional variables in the data set will be introduced shortly.) Traders Data Set Sample Variables 4 Observations LL 20:40 Ratio and Trading Profit for a Sample of 44 Traders Variables > Observations > Variable Type Observations Values Missing Form 20:40 Trading Profit Influence Stronger/Weaker Quantitative Quantitative Guantitative Qualitative Numeric Numeric Numeric Nonnumeric Variable Variable Variable Variable Correlation Correlation Use the tool to obtain a scatterplot of trading profit versus 20:40 ratio as follows: Click one of the Correlation sliding panels on the left side of the DataView tool. Select Trading Profit as the dependent variable and 20:40 as the Independent variable. Then dick the Scatter button. Use the tool to obtain a scatterplot of trading profit versus 20:40 ratio as follows: Click one of the Correlation sliding panels on the left side of the DataView tool. Select Trading Profit as the dependent variable and 20:4D as the independent variable. Then click the Scatter button. linear relationship between a trader's 2D:4D ratio and his trading Based on the scatterplot, there is a profit. The correlation coefficient isr Express the correlation coefficient to three decimal places. (Hint: Having already clicked a Correlation sliding panel and selected the dependent and independent variables, now click the Linear regression button.) How much influence does a particular point have on the correlation coefficient? To obtain a visual display of each point's influence, modify your scatterplot. Click the Scatter button, and select the variable influence in the dropdown menu for Scatter Point Size and the variable Stronger/Weaker in the dropdown menu for Scatter Point Color. Influence is the magnitude of the change in the correlation coefficient if the trader is dropped from the sample. Stronger/Weaker is a qualitative variable that indicates whether dropping the trader causes the correlation to be stronger or weaker. (Hint: Hovering your mouse over a point provides the point's coordinates as well as the values of Influence and Stronger/Weaker.) Dropping a green trader from the sample would have the effect of making the correlation The traders with the least influence on the correlation coefficient tend to have deviation scores that are relatively in magnitude of Influence and stronger/WeaRel. Dropping a green trader from the sample would have the effect of making the correlation The traders with the least influence on the correlation coefficient tend to have deviation scores that are relatively in magnitude. The trader with the biggest influence on the correlation coefficient is found in the corner on the scatterplot. If this trader was dropped from the sample, the magnitude of the correlation coefficient would by The 2D:4D ratio has been shown to be a marker of prenatal exposure to testosterone. Specifically, the longer the ring finger relative to the index finger (the smaller the 20:40 ratio), the greater the prenatal exposure to testosterone. Prenatal exposure to testosterone has been shown to increase risk preference, enhance visual scanning speed, and reduce reaction time. The correlation between 20:40 ratio and trading profit is not sufficient to establish causality, but which of the following explanations for the correlation is most plausible? The correlation between 20:40 ratio and successful financial trading is spurious. O Having a relatively long ring finger causes successful financial trading. Having a relatively long ring finger and successful financial trading are both correlated with prenatal exposure to testosterone. Successful financial trading causes a relatively long ring finger, Father


