

Answered step by step
Verified Expert Solution
Question
1 Approved Answer
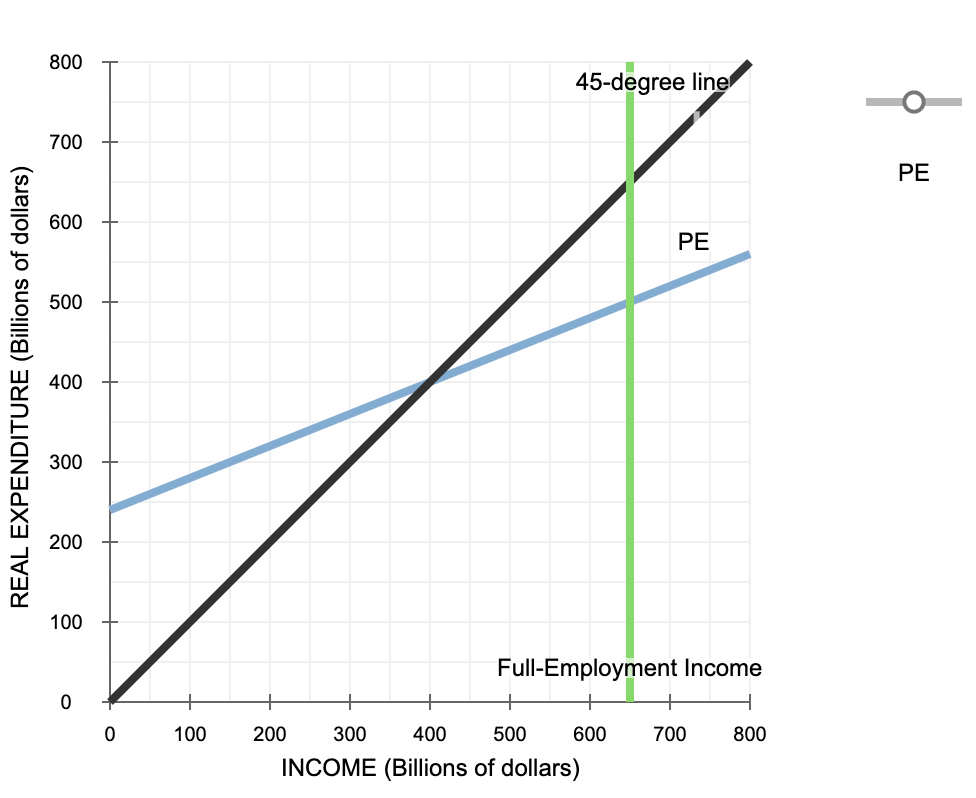
5. Expenditure Gaps On the graph, shift the PE line to show the change in the planned expenditure line necessary to close the income gap.
5. Expenditure Gaps
On the graph, shift the PE line to show the change in the planned expenditure line necessary to close the income gap.
Step by Step Solution
There are 3 Steps involved in it
Step: 1

Get Instant Access to Expert-Tailored Solutions
See step-by-step solutions with expert insights and AI powered tools for academic success
Step: 2

Step: 3
Ace Your Homework with AI
Get the answers you need in no time with our AI-driven, step-by-step assistance
Get Started
Principles Of Microeconomics 2e By OpenStax
Authors: OpenStax
2nd Edition
1947172344, 978-1947172340