5. For Section 300, provide answers to the following questions.
- Using the data from 2005-2009 of data collected, what would you predict, using a 95% confidence interval, for each category of ethnicity for Masters Degrees for 2010? Show all of your work, including assumptions and justification for the predictions.
- In examining all of the data in Section 300, provide a list of conclusions that can be drawn from this data.
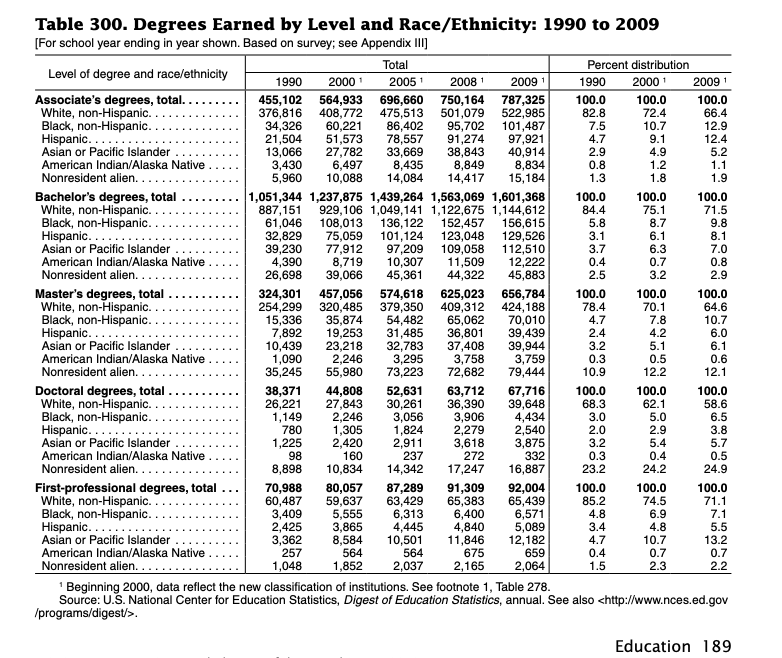
Table 300. Degrees Earned by Level and Race/Ethnicity: 1990 to 2009 [For school year ending in year shown. Based on survey; see Appendix II] Total Percent distribution Level of degree and race/ethnicity 1990 2000 2005 1 20081 2009 1 1990 2000 20091 Associate's degrees, total. 455,102 564,933 696,660 750,164 787,325 100.0 100.0 100.0 White, non-Hispanic. 376,816 408,772 475,513 501,079 522,985 82.8 72.4 66.4 Black, non-Hispanic. 34,326 60,221 86,402 95,702 101,487 7.5 10.7 12.9 Hispanic... 21,504 51,573 78,557 91,274 97,921 4.7 9.1 12.4 Asian or Pacific Islander 13,066 27,782 33,669 38,843 40,914 2.9 4.9 5.2 American Indian/Alaska Native 3,430 6,497 8,435 8,849 8,834 0.8 1.2 1.1 Nonresident alien... 5,960 10,088 14,084 14,417 15,184 1.3 1.8 1.9 Bachelor's degrees, total 1,051,344 1,237,875 1,439,264 1,563,069 1,601,368 100.0 100.0 100.0 White, non-Hispanic.. 887,151 929,106 1,049,141 1,122,675 1,144,612 84.4 75.1 71.5 Black, non-Hispanic. 61,046 108,013 136,122 152,457 156,615 5.8 8.7 9.8 Hispanic. 32,829 75,059 101,124 123,048 129,526 3.1 6.1 8.1 Asian or Pacific Islander 39,230 77,912 97,209 109,058 112,510 3.7 6.3 7.0 American Indian/Alaska Native 4,390 8,719 10,307 11,509 12,222 0.4 0.7 0.8 Nonresident alien.... 26,698 39,066 45,361 44,322 45,883 2.5 3.2 2.9 Master's degrees, total 324,301 457,056 574,618 625,023 656,784 100.0 100.0 100.0 White, non-Hispanic.. 254,299 320,485 379,350 409,312 424,188 78.4 70.1 64.6 Black, non-Hispanic. 15,336 35,874 54,482 65,062 70,010 4.7 7.8 10.7 Hispanic... 7,892 19,253 31,485 36,801 39,439 2.4 4.2 6.0 Asian or Pacific Islander 10,439 23,218 32,783 37,408 39,944 3.2 5.1 6.1 American Indian/Alaska Native 1,090 2,246 3,295 3,758 3,759 0.5 0.6 Nonresident alien.... 35,245 55,980 73,223 72,682 79,444 10.9 12.2 12.1 Doctoral degrees, total 38,371 44,808 52,631 63,712 67,716 100.0 100.0 100.0 White, non-Hispanic.. 26,221 27,843 30,261 36,390 39,648 68.3 62.1 58.6 Black, non-Hispanic. 1,149 2,246 3,056 3,906 4,434 3.0 5.0 6.5 Hispanic. 780 1,305 1,824 2,279 2,540 2.0 2.9 3.8 Asian or Pacific Islander 1,225 2,420 2,911 3,618 3,875 3.2 5.4 5.7 American Indian/Alaska Native 98 160 237 272 332 0.3 0.4 0.5 Nonresident alien. 8,898 10,834 14,342 17,247 16,887 23.2 24.2 24.9 First-professional degrees, total 70,988 80,057 87,289 91,309 92,004 100.0 100.0 100.0 White, non-Hispanic. 60,487 59,637 63,429 65,383 65,439 85.2 74.5 71.1 Black, non-Hispanic. 3,409 5,555 6,313 6,400 6,571 4.8 6.9 7.1 Hispanic.. 2,425 3,865 4,445 4,840 5,089 3.4 4.8 5.5 Asian or Pacific Islander 3,362 8,584 10,501 11,846 12,182 4.7 10.7 13.2 American Indian/Alaska Native 257 564 564 675 659 0.4 0.7 0.7 Nonresident alien.... 1,048 1,852 2,037 2,165 2,064 1.5 2.3 2.2 Beginning 2000, data reflect the new classification of institutions. See footnote 1, Table 278. Source: U.S. National Center for Education Statistics, Digest of Education Statistics, annual. See also
. 0.3 Education 189 Table 300. Degrees Earned by Level and Race/Ethnicity: 1990 to 2009 [For school year ending in year shown. Based on survey; see Appendix II] Total Percent distribution Level of degree and race/ethnicity 1990 2000 2005 1 20081 2009 1 1990 2000 20091 Associate's degrees, total. 455,102 564,933 696,660 750,164 787,325 100.0 100.0 100.0 White, non-Hispanic. 376,816 408,772 475,513 501,079 522,985 82.8 72.4 66.4 Black, non-Hispanic. 34,326 60,221 86,402 95,702 101,487 7.5 10.7 12.9 Hispanic... 21,504 51,573 78,557 91,274 97,921 4.7 9.1 12.4 Asian or Pacific Islander 13,066 27,782 33,669 38,843 40,914 2.9 4.9 5.2 American Indian/Alaska Native 3,430 6,497 8,435 8,849 8,834 0.8 1.2 1.1 Nonresident alien... 5,960 10,088 14,084 14,417 15,184 1.3 1.8 1.9 Bachelor's degrees, total 1,051,344 1,237,875 1,439,264 1,563,069 1,601,368 100.0 100.0 100.0 White, non-Hispanic.. 887,151 929,106 1,049,141 1,122,675 1,144,612 84.4 75.1 71.5 Black, non-Hispanic. 61,046 108,013 136,122 152,457 156,615 5.8 8.7 9.8 Hispanic. 32,829 75,059 101,124 123,048 129,526 3.1 6.1 8.1 Asian or Pacific Islander 39,230 77,912 97,209 109,058 112,510 3.7 6.3 7.0 American Indian/Alaska Native 4,390 8,719 10,307 11,509 12,222 0.4 0.7 0.8 Nonresident alien.... 26,698 39,066 45,361 44,322 45,883 2.5 3.2 2.9 Master's degrees, total 324,301 457,056 574,618 625,023 656,784 100.0 100.0 100.0 White, non-Hispanic.. 254,299 320,485 379,350 409,312 424,188 78.4 70.1 64.6 Black, non-Hispanic. 15,336 35,874 54,482 65,062 70,010 4.7 7.8 10.7 Hispanic... 7,892 19,253 31,485 36,801 39,439 2.4 4.2 6.0 Asian or Pacific Islander 10,439 23,218 32,783 37,408 39,944 3.2 5.1 6.1 American Indian/Alaska Native 1,090 2,246 3,295 3,758 3,759 0.5 0.6 Nonresident alien.... 35,245 55,980 73,223 72,682 79,444 10.9 12.2 12.1 Doctoral degrees, total 38,371 44,808 52,631 63,712 67,716 100.0 100.0 100.0 White, non-Hispanic.. 26,221 27,843 30,261 36,390 39,648 68.3 62.1 58.6 Black, non-Hispanic. 1,149 2,246 3,056 3,906 4,434 3.0 5.0 6.5 Hispanic. 780 1,305 1,824 2,279 2,540 2.0 2.9 3.8 Asian or Pacific Islander 1,225 2,420 2,911 3,618 3,875 3.2 5.4 5.7 American Indian/Alaska Native 98 160 237 272 332 0.3 0.4 0.5 Nonresident alien. 8,898 10,834 14,342 17,247 16,887 23.2 24.2 24.9 First-professional degrees, total 70,988 80,057 87,289 91,309 92,004 100.0 100.0 100.0 White, non-Hispanic. 60,487 59,637 63,429 65,383 65,439 85.2 74.5 71.1 Black, non-Hispanic. 3,409 5,555 6,313 6,400 6,571 4.8 6.9 7.1 Hispanic.. 2,425 3,865 4,445 4,840 5,089 3.4 4.8 5.5 Asian or Pacific Islander 3,362 8,584 10,501 11,846 12,182 4.7 10.7 13.2 American Indian/Alaska Native 257 564 564 675 659 0.4 0.7 0.7 Nonresident alien.... 1,048 1,852 2,037 2,165 2,064 1.5 2.3 2.2 Beginning 2000, data reflect the new classification of institutions. See footnote 1, Table 278. Source: U.S. National Center for Education Statistics, Digest of Education Statistics, annual. See also
. 0.3 Education 189