Answered step by step
Verified Expert Solution
Question
1 Approved Answer
5. Go to Yahoo Finance and obtain the monthly adjusted-closing prices for General Motors (GM) and the S&P500 Index (^GSPC) from 1st Jan 2016

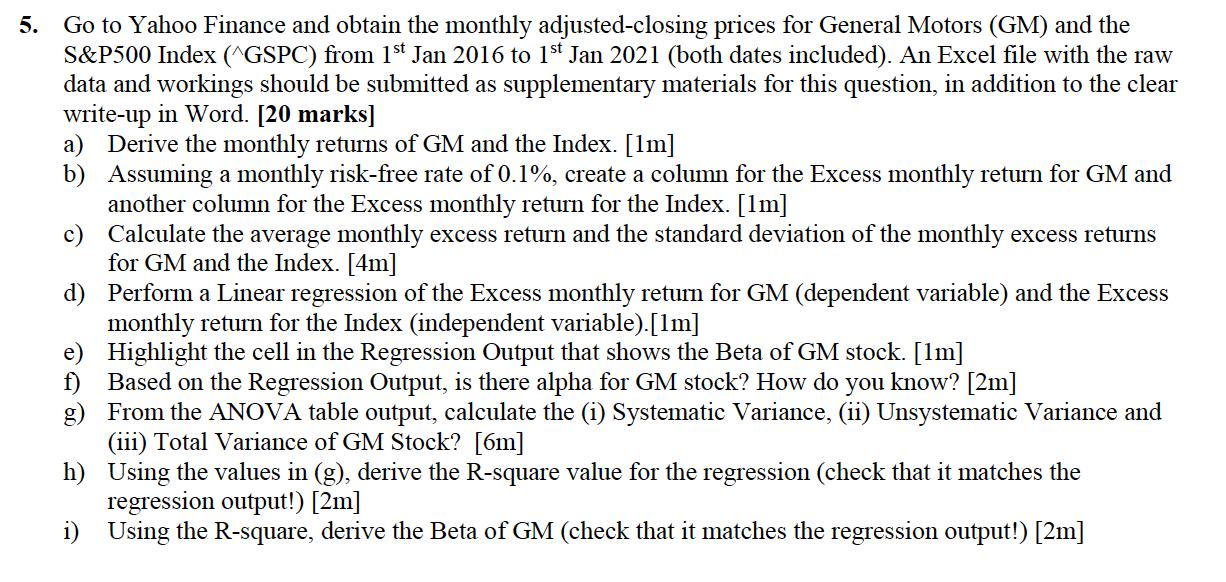
5. Go to Yahoo Finance and obtain the monthly adjusted-closing prices for General Motors (GM) and the S&P500 Index (^GSPC) from 1st Jan 2016 to 1st Jan 2021 (both dates included). An Excel file with the raw data and workings should be submitted as supplementary materials for this question, in addition to the clear write-up in Word. [20 marks] a) Derive the monthly returns of GM and the Index. [1m] b) Assuming a monthly risk-free rate of 0.1%, create a column for the Excess monthly return for GM and another column for the Excess monthly return for the Index. [1m] c) Calculate the average monthly excess return and the standard deviation of the monthly excess returns for GM and the Index. [4m] d) Perform a Linear regression of the Excess monthly return for GM (dependent variable) and the Excess monthly return for the Index (independent variable).[1m] e) Highlight the cell in the Regression Output that shows the Beta of GM stock. [1m] f) Based on the Regression Output, is there alpha for GM stock? How do you know? [2m] g) From the ANOVA table output, calculate the (i) Systematic Variance, (ii) Unsystematic Variance and (iii) Total Variance of GM Stock? [6m] h) Using the values in (g), derive the R-square value for the regression (check that it matches the regression output!) [2m] i) Using the R-square, derive the Beta of GM (check that it matches the regression output!) [2m]
Step by Step Solution
There are 3 Steps involved in it
Step: 1

Get Instant Access to Expert-Tailored Solutions
See step-by-step solutions with expert insights and AI powered tools for academic success
Step: 2

Step: 3

Ace Your Homework with AI
Get the answers you need in no time with our AI-driven, step-by-step assistance
Get Started


