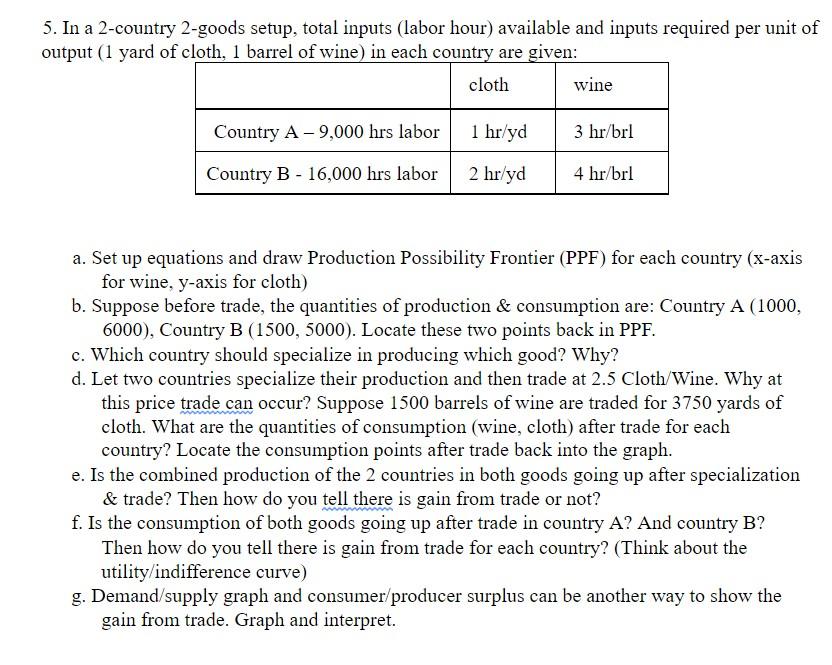
5. In a 2-country 2-goods setup, total inputs (labor hour) available and inputs required per unit of output (1 yard of cloth, 1 barrel of wine) in each country are given: cloth wine Country A -9,000 hrs labor 1 hr/yd 3 hr/brl Country B - 16,000 hrs labor 2 hr/yd 4 hr/brl a. Set up equations and draw Production Possibility Frontier (PPF) for each country (x-axis for wine, y-axis for cloth) b. Suppose before trade, the quantities of production & consumption are: Country A (1000, 6000), Country B (1500, 5000). Locate these two points back in PPF. c. Which country should specialize in producing which good? Why? d. Let two countries specialize their production and then trade at 2.5 Cloth/Wine. Why at this price trade can occur? Suppose 1500 barrels of wine are traded for 3750 yards of cloth. What are the quantities of consumption (wine, cloth) after trade for each country? Locate the consumption points after trade back into the graph. e. Is the combined production of the 2 countries in both goods going up after specialization & trade? Then how do you tell there is gain from trade or not? f. Is the consumption of both goods going up after trade in country A? And country B? Then how do you tell there is gain from trade for each country? (Think about the utility/indifference curve) g. Demand/supply graph and consumer/producer surplus can be another way to show the gain from trade. Graph and interpret. 5. In a 2-country 2-goods setup, total inputs (labor hour) available and inputs required per unit of output (1 yard of cloth, 1 barrel of wine) in each country are given: cloth wine Country A -9,000 hrs labor 1 hr/yd 3 hr/brl Country B - 16,000 hrs labor 2 hr/yd 4 hr/brl a. Set up equations and draw Production Possibility Frontier (PPF) for each country (x-axis for wine, y-axis for cloth) b. Suppose before trade, the quantities of production & consumption are: Country A (1000, 6000), Country B (1500, 5000). Locate these two points back in PPF. c. Which country should specialize in producing which good? Why? d. Let two countries specialize their production and then trade at 2.5 Cloth/Wine. Why at this price trade can occur? Suppose 1500 barrels of wine are traded for 3750 yards of cloth. What are the quantities of consumption (wine, cloth) after trade for each country? Locate the consumption points after trade back into the graph. e. Is the combined production of the 2 countries in both goods going up after specialization & trade? Then how do you tell there is gain from trade or not? f. Is the consumption of both goods going up after trade in country A? And country B? Then how do you tell there is gain from trade for each country? (Think about the utility/indifference curve) g. Demand/supply graph and consumer/producer surplus can be another way to show the gain from trade. Graph and interpret


