Answered step by step
Verified Expert Solution
Question
1 Approved Answer
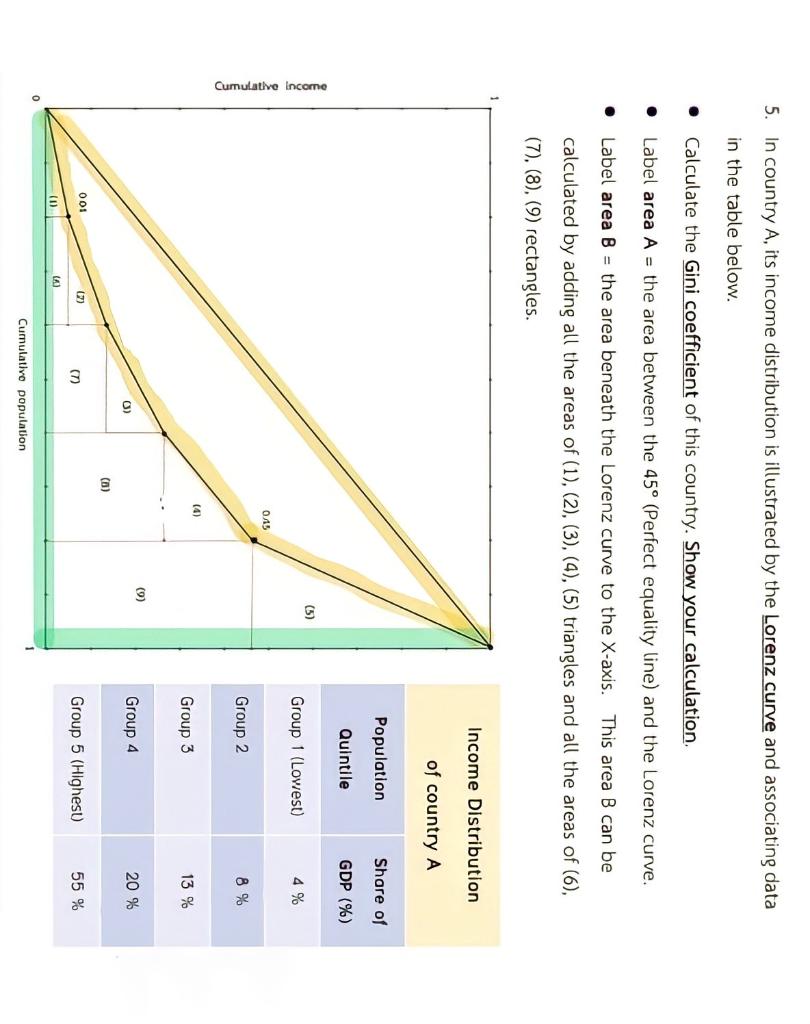
5. In country A, its income distribution is illustrated by the Lorenz curve and associating data in the table below. - Calculate the Gini coefficient
Step by Step Solution
There are 3 Steps involved in it
Step: 1

Get Instant Access to Expert-Tailored Solutions
See step-by-step solutions with expert insights and AI powered tools for academic success
Step: 2

Step: 3
Ace Your Homework with AI
Get the answers you need in no time with our AI-driven, step-by-step assistance
Get Started