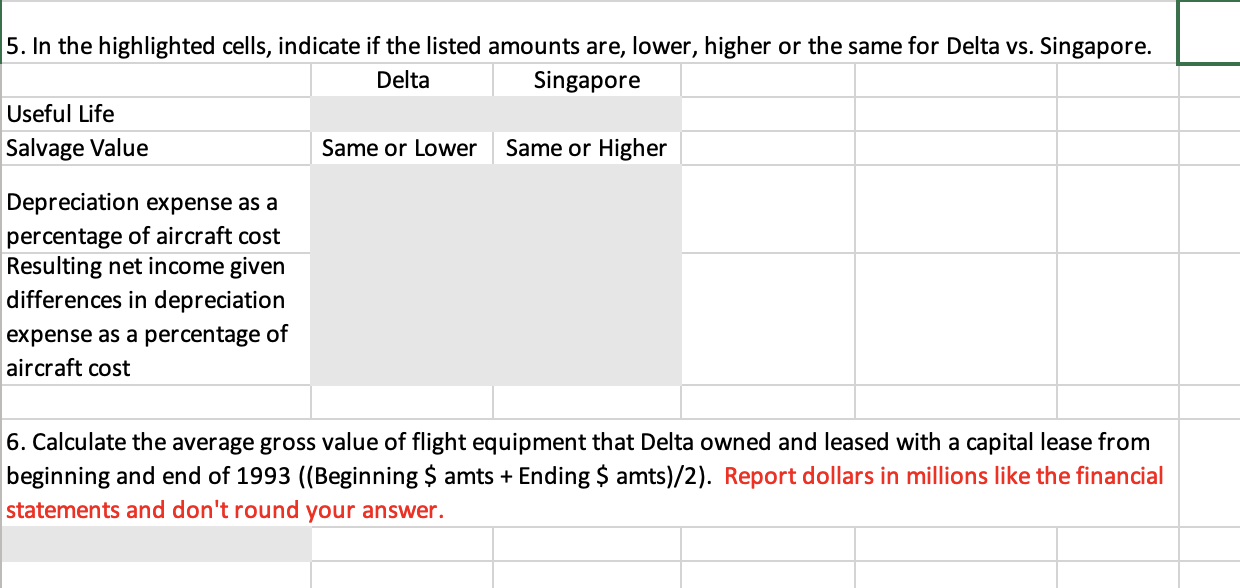
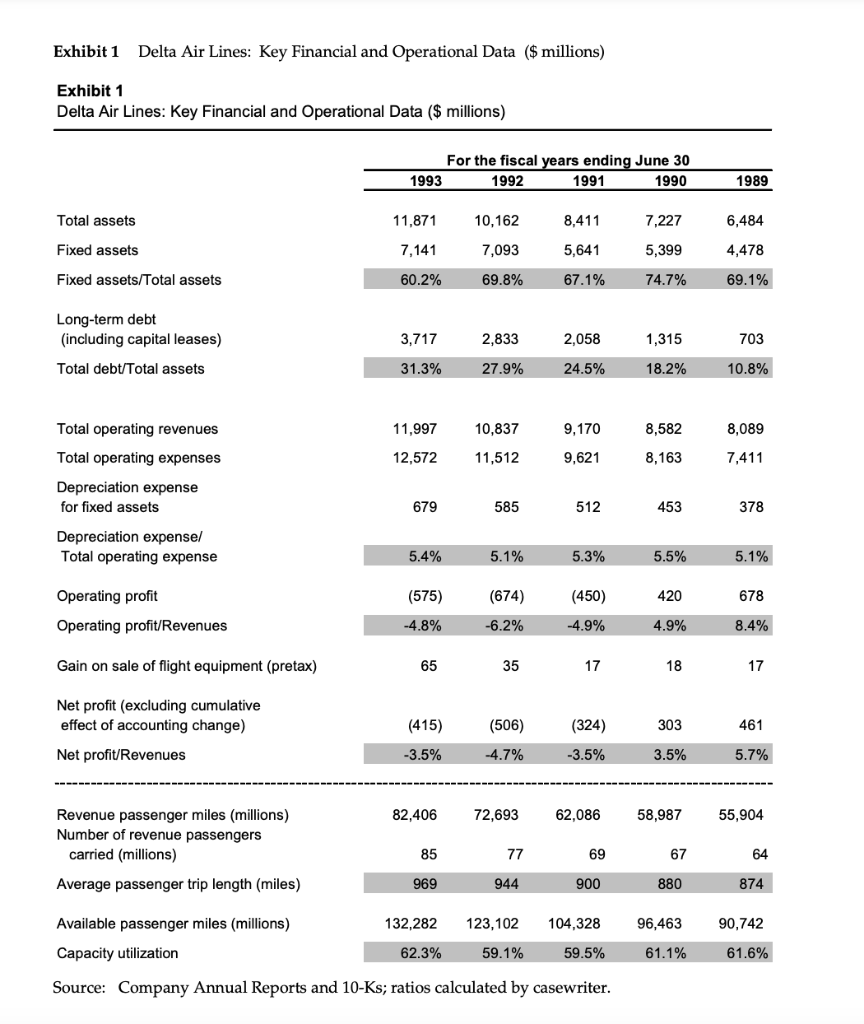
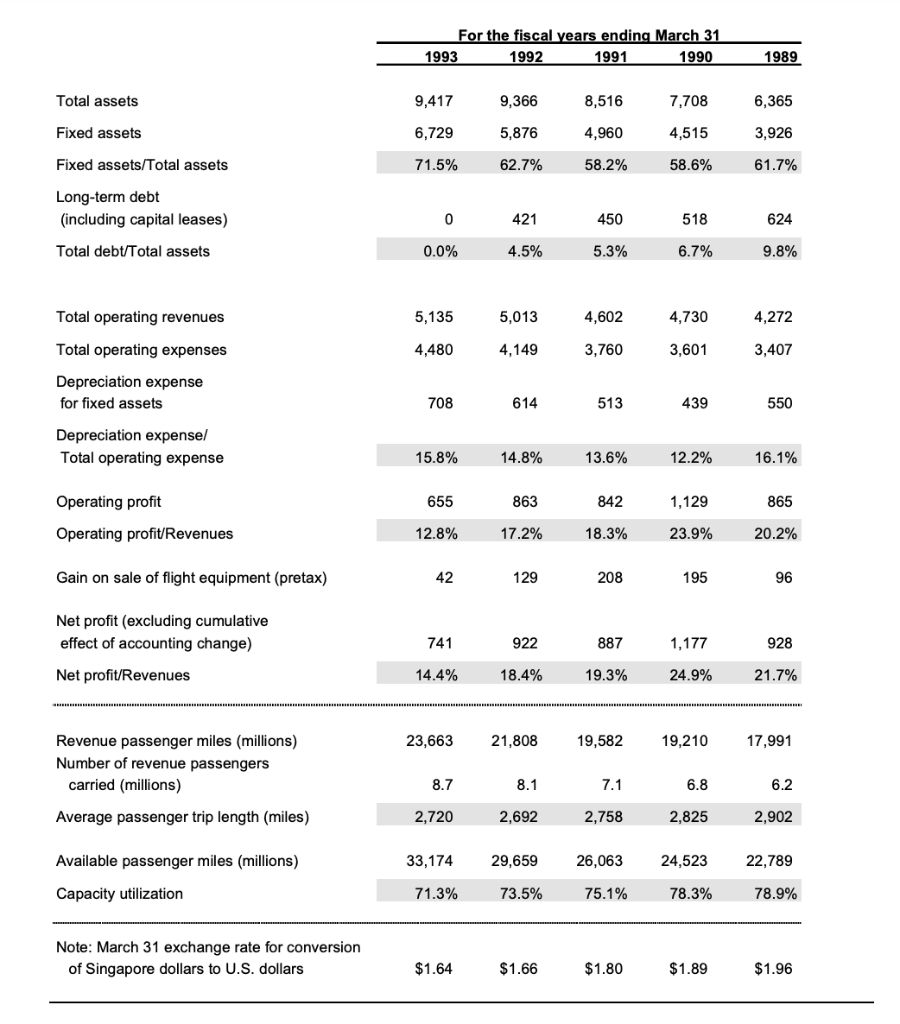
5. In the highlighted cells, indicate if the listed amounts are, lower, higher or the same for Delta vs. Singapore. Delta Singapore Useful Life Salvage Value Same or Lower Same or Higher Depreciation expense as a percentage of aircraft cost Resulting net income given differences in depreciation expense as a percentage of aircraft cost 6. Calculate the average gross value of flight equipment that Delta owned and leased with a capital lease from beginning and end of 1993 ((Beginning $ amts + Ending $ amts)/2). Report dollars in millions like the financial statements and don't round your answer. Exhibit 1 Delta Air Lines: Key Financial and Operational Data ($ millions) Exhibit 1 Delta Air Lines: Key Financial and Operational Data ($ millions) For the fiscal years ending June 30 1993 1992 1991 1990 1989 Total assets 11,871 10,162 8,411 7,227 6,484 Fixed assets 7,141 7,093 5,641 5,399 4,478 Fixed assets/Total assets 60.2% 69.8% 67.1% 74.7% 69.1% Long-term debt (including capital leases) Total debt/Total assets 3,717 2,833 2,058 1,315 703 31.3% 27.9% 24.5% 18.2% 10.8% 11,997 10,837 9,170 8,582 8,089 Total operating revenues Total operating expenses 12,572 11,512 9,621 8,163 7,411 Depreciation expense for fixed assets 679 585 512 453 378 Depreciation expensel Total operating expense 5.4% 5.1% 5.3% 5.5% 5.1% (575) (674) 420 678 Operating profit Operating profit/Revenues (450) -4.9% -4.8% -6.2% 4.9% 8.4% Gain on sale of flight equipment (pretax) 65 35 17 18 17 Net profit (excluding cumulative effect of accounting change) Net profit/Revenues (415) (506) (324) 303 461 -3.5% -4.7% -3.5% 3.5% 5.7% 82,406 72,693 62,086 58,987 55,904 Revenue passenger miles (millions) Number of revenue passengers carried (millions) Average passenger trip length (miles) 85 77 69 67 64 969 944 900 880 874 Available passenger miles (millions) 132,282 123,102 104,328 96,463 90,742 Capacity utilization 62.3% 59.1% 59.5% 61.1% 61.6% Source: Company Annual Reports and 10-Ks; ratios calculated by casewriter. For the fiscal years ending March 31 1993 1992 1991 1990 1989 Total assets 9,417 9,366 8,516 7,708 6,365 Fixed assets 6,729 5,876 4,960 4,515 3,926 Fixed assets/Total assets 71.5% 62.7% 58.2% 58.6% 61.7% Long-term debt (including capital leases) 0 421 450 518 624 Total debt/Total assets 0.0% 4.5% 5.3% 6.7% 9.8% Total operating revenues 5,135 5.013 4,602 4,730 4,272 Total operating expenses 4,480 4,149 3,760 3,601 3,407 Depreciation expense for fixed assets 708 614 513 439 550 Depreciation expensel Total operating expense 15.8% 14.8% 13.6% 12.2% 16.1% Operating profit 655 863 842 1,129 865 Operating profit/Revenues 12.8% 17.2% 18.3% 23.9% 20.2% Gain on sale of flight equipment (pretax) 42 129 208 195 96 Net profit (excluding cumulative effect of accounting change) Net profit/Revenues 741 922 887 1,177 928 14.4% 18.4% 19.3% 24.9% 21.7% 23,663 21,808 19,582 19,210 17,991 Revenue passenger miles (millions) Number of revenue passengers carried (millions) 8.7 8.1 7.1 6.8 6.2 Average passenger trip length (miles) 2,720 2,692 2,758 2,825 2,902 Available passenger miles (millions) 33,174 29,659 26,063 24,523 22,789 Capacity utilization 71.3% 73.5% 75.1% 78.3% 78.9% Note: March 31 exchange rate for conversion of Singapore dollars to U.S. dollars $1.64 $1.66 $1.80 $1.89 $1.96 5. In the highlighted cells, indicate if the listed amounts are, lower, higher or the same for Delta vs. Singapore. Delta Singapore Useful Life Salvage Value Same or Lower Same or Higher Depreciation expense as a percentage of aircraft cost Resulting net income given differences in depreciation expense as a percentage of aircraft cost 6. Calculate the average gross value of flight equipment that Delta owned and leased with a capital lease from beginning and end of 1993 ((Beginning $ amts + Ending $ amts)/2). Report dollars in millions like the financial statements and don't round your answer. Exhibit 1 Delta Air Lines: Key Financial and Operational Data ($ millions) Exhibit 1 Delta Air Lines: Key Financial and Operational Data ($ millions) For the fiscal years ending June 30 1993 1992 1991 1990 1989 Total assets 11,871 10,162 8,411 7,227 6,484 Fixed assets 7,141 7,093 5,641 5,399 4,478 Fixed assets/Total assets 60.2% 69.8% 67.1% 74.7% 69.1% Long-term debt (including capital leases) Total debt/Total assets 3,717 2,833 2,058 1,315 703 31.3% 27.9% 24.5% 18.2% 10.8% 11,997 10,837 9,170 8,582 8,089 Total operating revenues Total operating expenses 12,572 11,512 9,621 8,163 7,411 Depreciation expense for fixed assets 679 585 512 453 378 Depreciation expensel Total operating expense 5.4% 5.1% 5.3% 5.5% 5.1% (575) (674) 420 678 Operating profit Operating profit/Revenues (450) -4.9% -4.8% -6.2% 4.9% 8.4% Gain on sale of flight equipment (pretax) 65 35 17 18 17 Net profit (excluding cumulative effect of accounting change) Net profit/Revenues (415) (506) (324) 303 461 -3.5% -4.7% -3.5% 3.5% 5.7% 82,406 72,693 62,086 58,987 55,904 Revenue passenger miles (millions) Number of revenue passengers carried (millions) Average passenger trip length (miles) 85 77 69 67 64 969 944 900 880 874 Available passenger miles (millions) 132,282 123,102 104,328 96,463 90,742 Capacity utilization 62.3% 59.1% 59.5% 61.1% 61.6% Source: Company Annual Reports and 10-Ks; ratios calculated by casewriter. For the fiscal years ending March 31 1993 1992 1991 1990 1989 Total assets 9,417 9,366 8,516 7,708 6,365 Fixed assets 6,729 5,876 4,960 4,515 3,926 Fixed assets/Total assets 71.5% 62.7% 58.2% 58.6% 61.7% Long-term debt (including capital leases) 0 421 450 518 624 Total debt/Total assets 0.0% 4.5% 5.3% 6.7% 9.8% Total operating revenues 5,135 5.013 4,602 4,730 4,272 Total operating expenses 4,480 4,149 3,760 3,601 3,407 Depreciation expense for fixed assets 708 614 513 439 550 Depreciation expensel Total operating expense 15.8% 14.8% 13.6% 12.2% 16.1% Operating profit 655 863 842 1,129 865 Operating profit/Revenues 12.8% 17.2% 18.3% 23.9% 20.2% Gain on sale of flight equipment (pretax) 42 129 208 195 96 Net profit (excluding cumulative effect of accounting change) Net profit/Revenues 741 922 887 1,177 928 14.4% 18.4% 19.3% 24.9% 21.7% 23,663 21,808 19,582 19,210 17,991 Revenue passenger miles (millions) Number of revenue passengers carried (millions) 8.7 8.1 7.1 6.8 6.2 Average passenger trip length (miles) 2,720 2,692 2,758 2,825 2,902 Available passenger miles (millions) 33,174 29,659 26,063 24,523 22,789 Capacity utilization 71.3% 73.5% 75.1% 78.3% 78.9% Note: March 31 exchange rate for conversion of Singapore dollars to U.S. dollars $1.64 $1.66 $1.80 $1.89 $1.96