Answered step by step
Verified Expert Solution
Link Copied!

Question

1 Approved Answer

5. Listed below are the ACT scores of 40 randomly selected students at a major university. 18 22 13 15 24 24 20 19 19
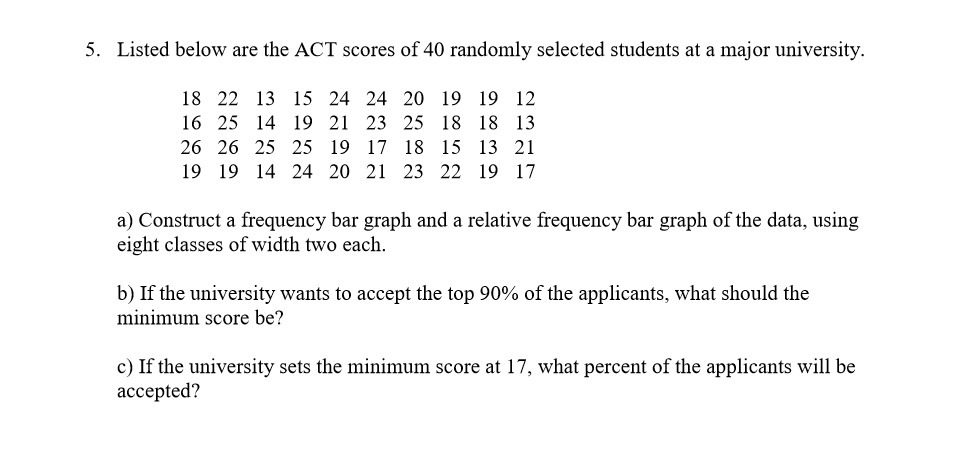
image text in transcribed
5. Listed below are the ACT scores of 40 randomly selected students at a major university. 18 22 13 15 24 24 20 19 19 12 16 25 14 19 21 23 25 13 18 13 26 26 25 25 19 1? 13 15 13 21 19 19 14 24 20 21 23 22 19 17 a) Construct a frequency bar graph and a relative frequency bar graph of the data, using eight classes of width two each. h) Ifthe university wants to accept the top 90% of the applicants, what should the minimum score be? c) If the university sets the minimum score at 17, what percent of the applicants will be accepted

Step by Step Solution

There are 3 Steps involved in it

Step: 1

blur-text-image

Get Instant Access to Expert-Tailored Solutions

See step-by-step solutions with expert insights and AI powered tools for academic success

Step: 2

blur-text-image

Step: 3

blur-text-image

Ace Your Homework with AI

Get the answers you need in no time with our AI-driven, step-by-step assistance

Get Started

Recommended Textbook for

Numerical Analysis

Authors: Richard L. Burden, J. Douglas Faires

9th edition

538733519, 978-1133169338, 1133169333, 978-0538733519

More Books

Students also viewed these Mathematics questions