

Answered step by step
Verified Expert Solution
Question
1 Approved Answer
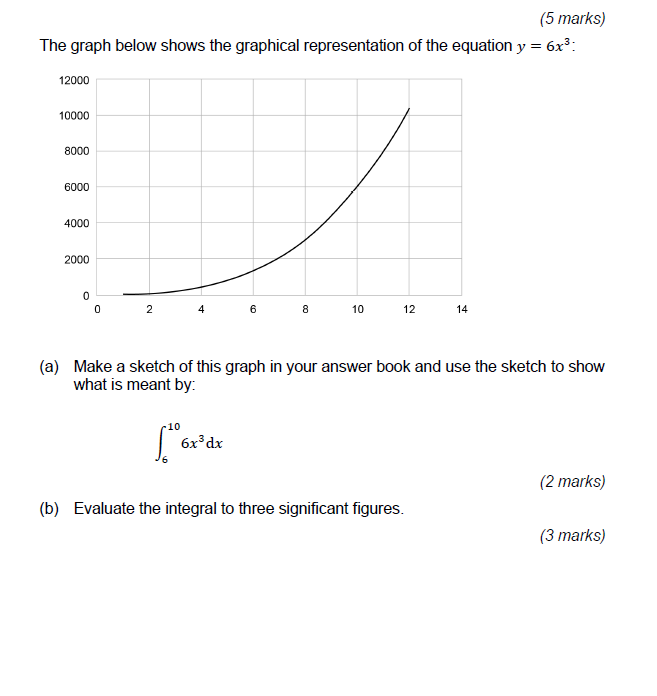
(5 marks) The graph below shows the graphical representation of the equation y = 6x3: 12000 10000 8000 6000 4000 2000 (a) Make a sketch
Step by Step Solution
There are 3 Steps involved in it
Step: 1

Get Instant Access to Expert-Tailored Solutions
See step-by-step solutions with expert insights and AI powered tools for academic success
Step: 2

Step: 3
Ace Your Homework with AI
Get the answers you need in no time with our AI-driven, step-by-step assistance
Get Started
Shape Optimization And Optimal Design
Authors: John Cagnol
1st Edition
0824705564, 978-0824705565