

Answered step by step
Verified Expert Solution
Question
1 Approved Answer
5 Model (2) in Table 9.2 of Stock and Watson ) regresses TestScore on STR, Percentage of English Learners (English), Percentage of Students with
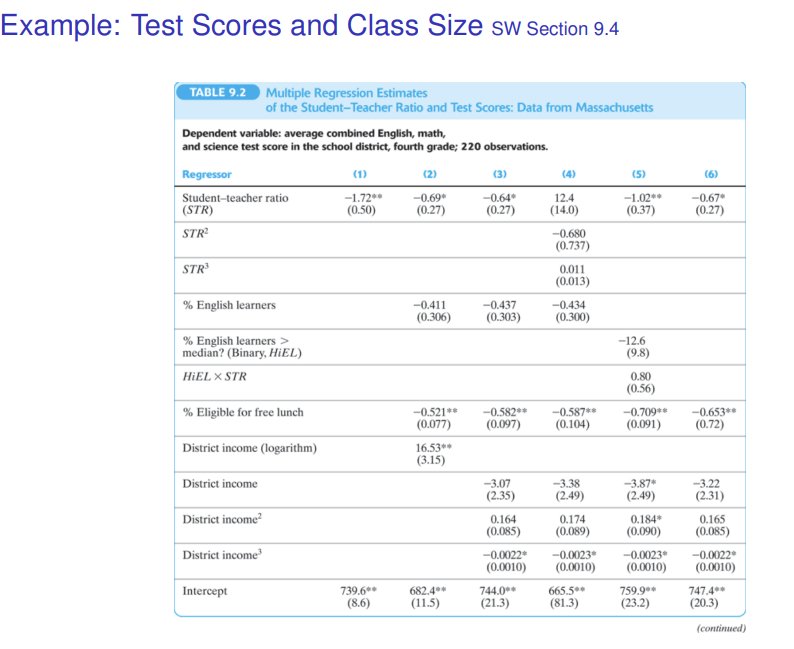
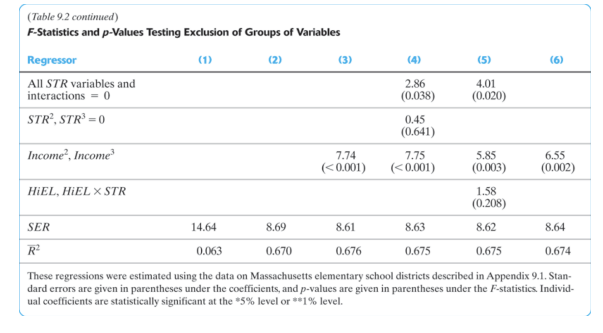
5 Model (2) in Table 9.2 of Stock and Watson ) regresses TestScore on STR, Percentage of English Learners (English), Percentage of Students with lunch support (Lunch), and logarithm of District Income. Re-estimate the regression model by adding the interaction term, English x STR, in Model (2). What is the estimated coeffcient on STR (two decimal places)? QUESTION 6 Using the estimated model in Question 5 that included an interaction term, you test Ho: Test Score does not depend on English. What is the p-value for this test (two decimal places)? Example: Test Scores and Class Size Sw Section 9.4 TABLE 9.2 Multiple Regression Estimates of the Student-Teacher Ratio and Test Scores: Data from Massachusetts Dependent variable: average combined English, math, and science test score in the school district, fourth grade; 220 observations. Regressor (1) (2) (3) (4) (5) (6) Student-teacher ratio -1.72** -0.69* -0.64 12.4 -1.02** -0.67 (STR) (0.50) (0.27) (0.27) (14.0) (0.37) (0.27) STR -0.680 (0.737) STR 0.011 (0.013) % English learners -0.411 (0.306) -0.437 -0.434 (0.303) (0.300) % English learners > -12.6 median? (Binary, HiEL) (9.8) HIEL XSTR 0.80 (0.56) % Eligible for free lunch -0.521** (0.077) -0.582** -0.587** -0.709** -0.653** (0.097) (0.104) (0.091) (0.72) District income (logarithm) 16.53** (3.15) District income -3.07 -3.38 -3.87* -3.22 (2.35) (2.49) (2.49) (2.31) District income 0.164 0.174 0.184* 0.165 (0.085) (0.089) (0.090) (0.085) District income -0.0022* -0.0023 -0.0023 -0.0022 (0.0010) (0.0010) (0.0010) (0.0010) Intercept 739.6** 682.4** 744.0** 665.5** 759.9** 747.4** (8.6) (11.5) (21.3) (81.3) (23.2) (20.3) (continued) (Table 9.2 continued) F-Statistics and p-Values Testing Exclusion of Groups of Variables Regressor All STR variables and interactions = 0 STR, STR=0 Income, Income HiEL, HIEL STR SER R (1) (2) (3) (4) (5) (6) 2.86 (0.038) 4.01 (0.020) 0.45 (0.641) 7.74 (
Step by Step Solution
There are 3 Steps involved in it
Step: 1

Get Instant Access to Expert-Tailored Solutions
See step-by-step solutions with expert insights and AI powered tools for academic success
Step: 2

Step: 3
Ace Your Homework with AI
Get the answers you need in no time with our AI-driven, step-by-step assistance
Get Started
Principles Of Econometrics
Authors: R Carter Hill, William E Griffiths, Guay C Lim
5th Edition
1118452275, 9781118452271