

Answered step by step
Verified Expert Solution
Question
1 Approved Answer
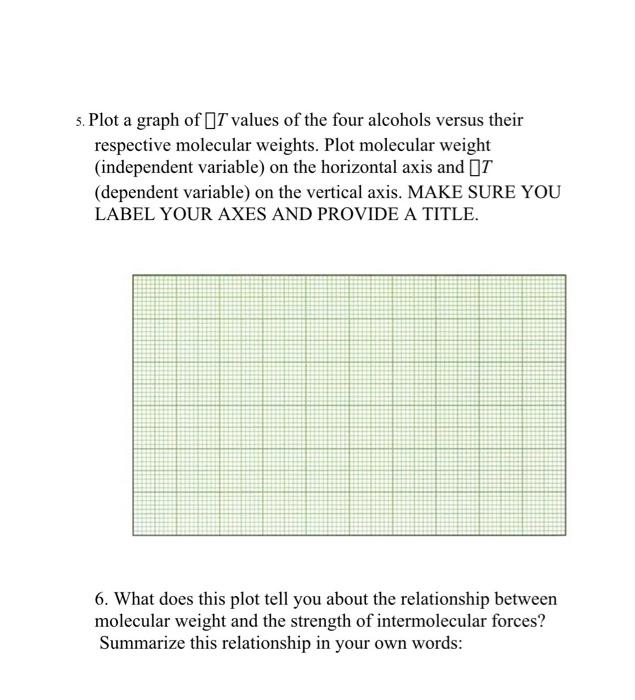
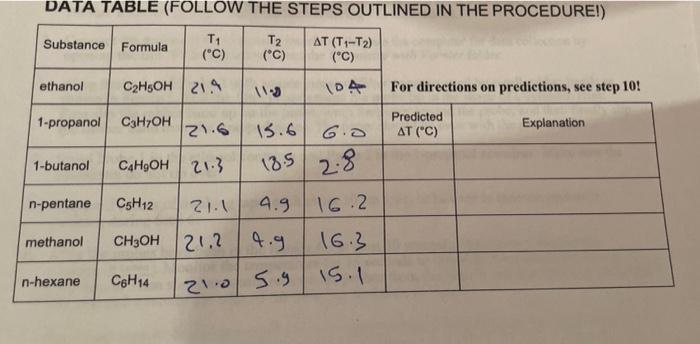
5. Plot a graph of JT values of the four alcohols versus their respective molecular weights. Plot molecular weight (independent variable) on the horizontal axis
Step by Step Solution
There are 3 Steps involved in it
Step: 1

Get Instant Access to Expert-Tailored Solutions
See step-by-step solutions with expert insights and AI powered tools for academic success
Step: 2

Step: 3
Ace Your Homework with AI
Get the answers you need in no time with our AI-driven, step-by-step assistance
Get Started
Physical Chemistry
Authors: Peter Atkins
7th Edition
978-0716735397, 716735393, 978-0716743880