Answered step by step
Verified Expert Solution
Question
1 Approved Answer
5. Portfolio Statistics and Diversification (point 30%) L0-4: Apply Portfolio Statistics and Diversification At the end of 2020, you decide to investigate stocks in attempt
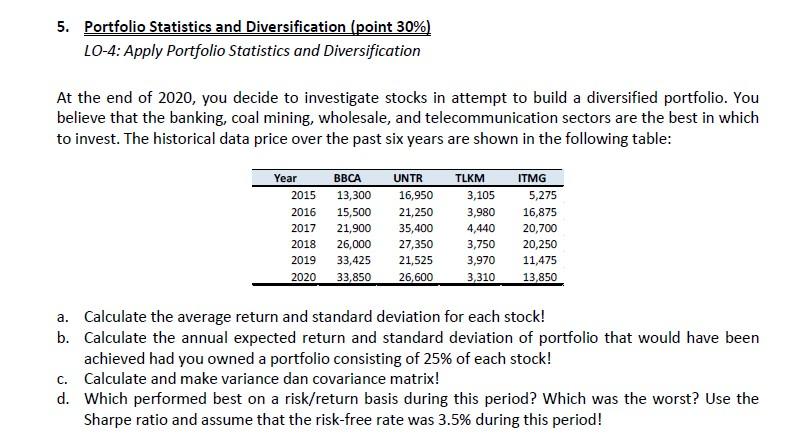
5. Portfolio Statistics and Diversification (point 30%) L0-4: Apply Portfolio Statistics and Diversification At the end of 2020, you decide to investigate stocks in attempt to build a diversified portfolio. You believe that the banking, coal mining, wholesale, and telecommunication sectors are the best in which to invest. The historical data price over the past six years are shown in the following table: Year 2015 2016 2017 2018 2019 2020 BBCA 13,300 15,500 21,900 26,000 33,425 33,850 UNTR 16,950 21,250 35,400 27,350 21,525 26,600 TLKM 3,105 3,980 4,440 3,750 3,970 3,310 ITMG 5,275 16,875 20,700 20,250 11,475 13,850 a. Calculate the average return and standard deviation for each stock! b. Calculate the annual expected return and standard deviation of portfolio that would have been achieved had you owned a portfolio consisting of 25% of each stock! C. Calculate and make variance dan covariance matrix! d. Which performed best on a risk/return basis during this period? Which was the worst? Use the Sharpe ratio and assume that the risk-free rate was 3.5% during this period
Step by Step Solution
There are 3 Steps involved in it
Step: 1
Get Instant Access to Expert-Tailored Solutions
See step-by-step solutions with expert insights and AI powered tools for academic success
Step: 2
Step: 3
Ace Your Homework with AI
Get the answers you need in no time with our AI-driven, step-by-step assistance
Get Started