

Answered step by step
Verified Expert Solution
Question
1 Approved Answer
5 Pr. 31 Saved Help Save & Exit 1 A CVP graph such as the one shown below is a useful technique for showing relationships
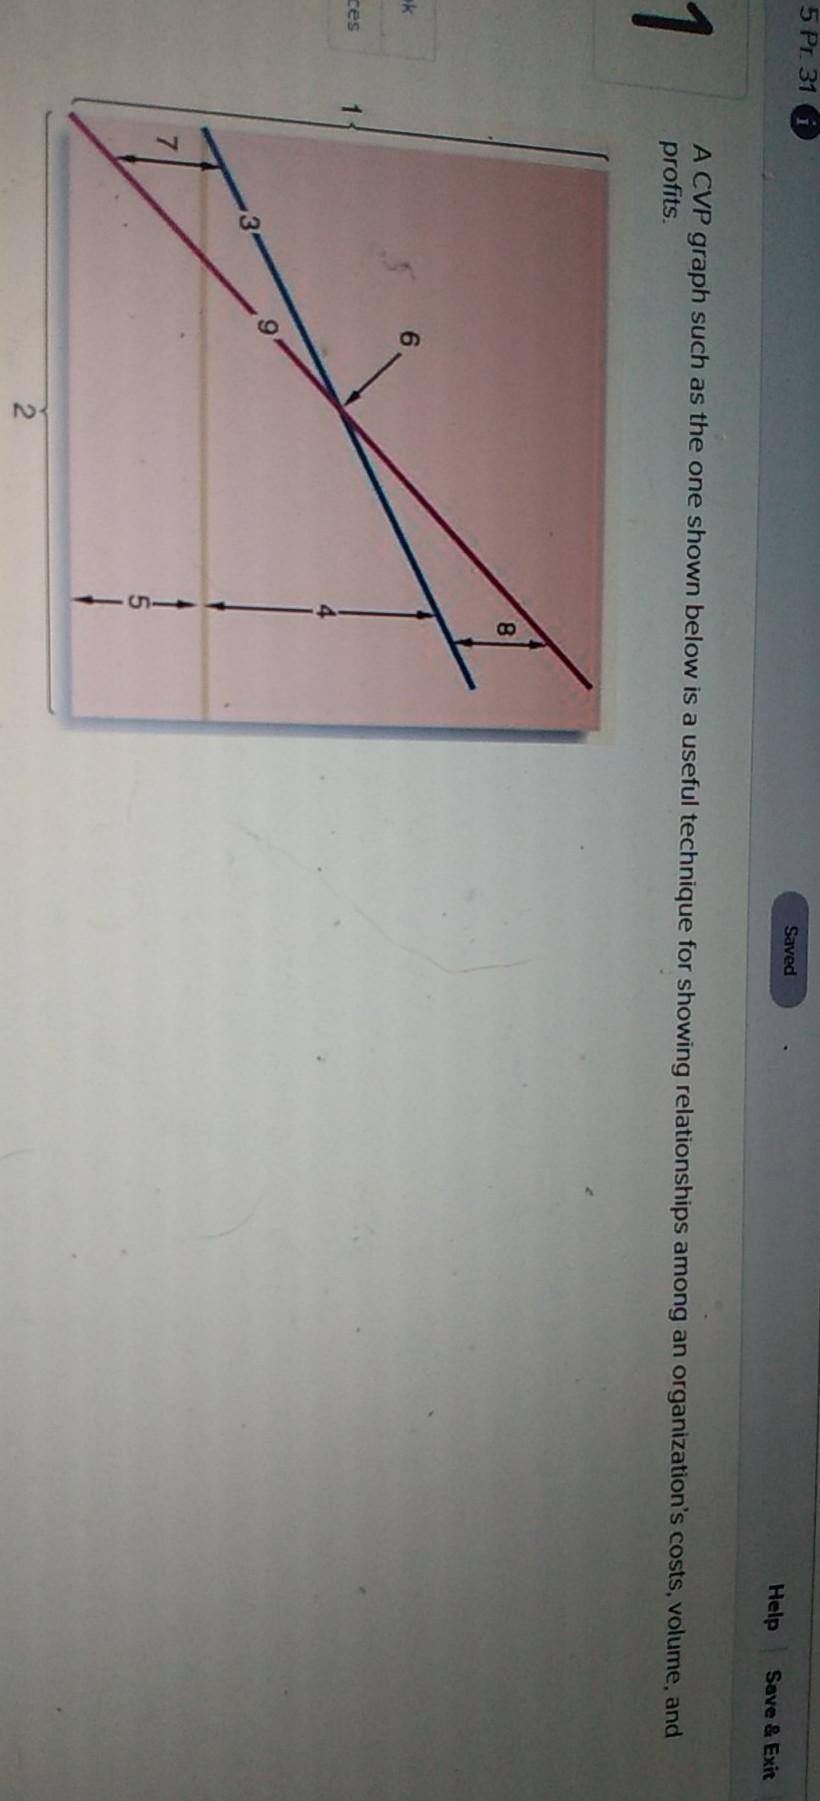
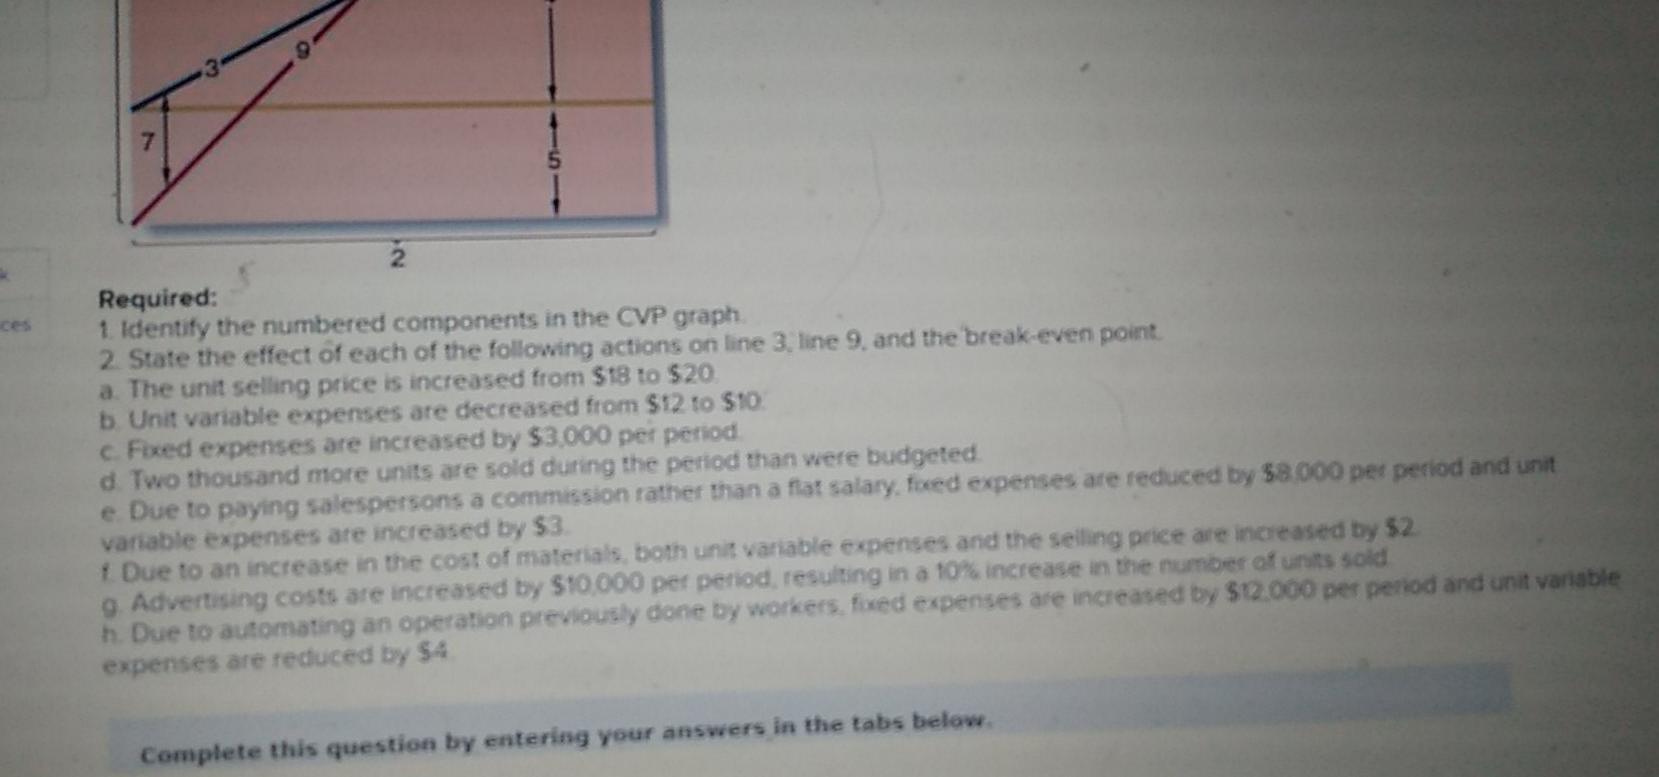
5 Pr. 31 Saved Help Save & Exit 1 A CVP graph such as the one shown below is a useful technique for showing relationships among an organization's costs, volume, and profits. 8 k ces 3 2 3 Required: 1. Identify the numbered components in the CVP graph 2. State the effect of each of the following actions on line 3 line 9. and the break-even point a. The unit selling price is increased from $18 to $20. b Unit variable expenses are decreased from $12 to $10. c. Fixed expenses are increased by $3.000 per period d. Two thousand more units are sold during the period than were budgeted. e Due to paying salespersons a commission rather than a flat salary, freed expenses are reduced by $8.000 per period and unit variable expenses are increased by $3 1 Due to an increase in the cost of materials, both unit Variable expenses and the selling price are increased by 52 9. Advertising costs are increased by $10,000 per period, resulting in a 10% increase in the number of units sold h. Due to automating an operation previously done by workers, fixed expenses are increased by $12.000 per period and unit variable expenses are reduced by $4 Complete this question by entering your answers in the tabs below
Step by Step Solution
There are 3 Steps involved in it
Step: 1

Get Instant Access to Expert-Tailored Solutions
See step-by-step solutions with expert insights and AI powered tools for academic success
Step: 2

Step: 3
Ace Your Homework with AI
Get the answers you need in no time with our AI-driven, step-by-step assistance
Get Started
How To Avoid IRS Audits
Authors: Victor S. Sy, CPA, MBA, Allana Santos, Roger Oriel, Louie Gajardo, Malou Aguilar Bledsoe, RJ Oriel, Mark Xavier Bautista, Kenno Samulde, Morton D Rosenthal Esq.
1st Edition
1530746477, 978-1530746477