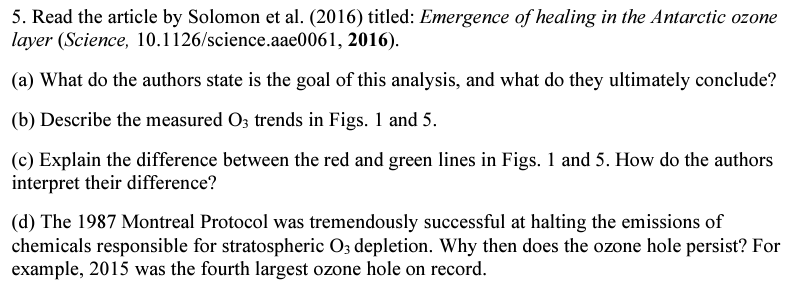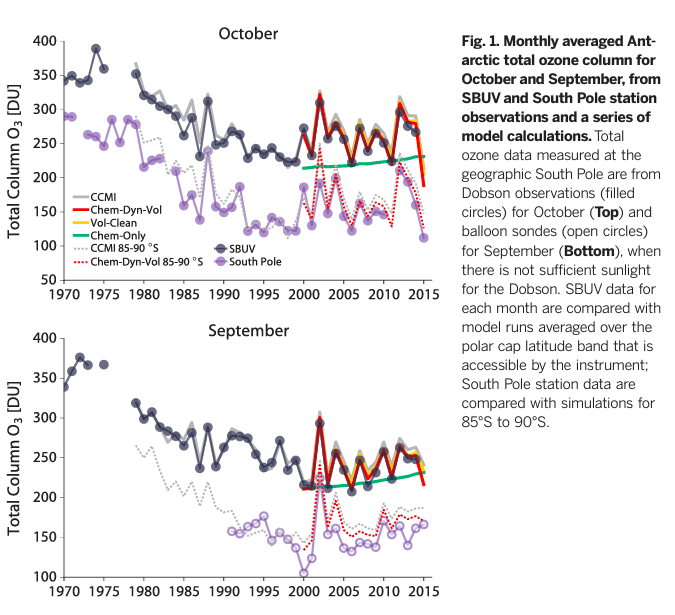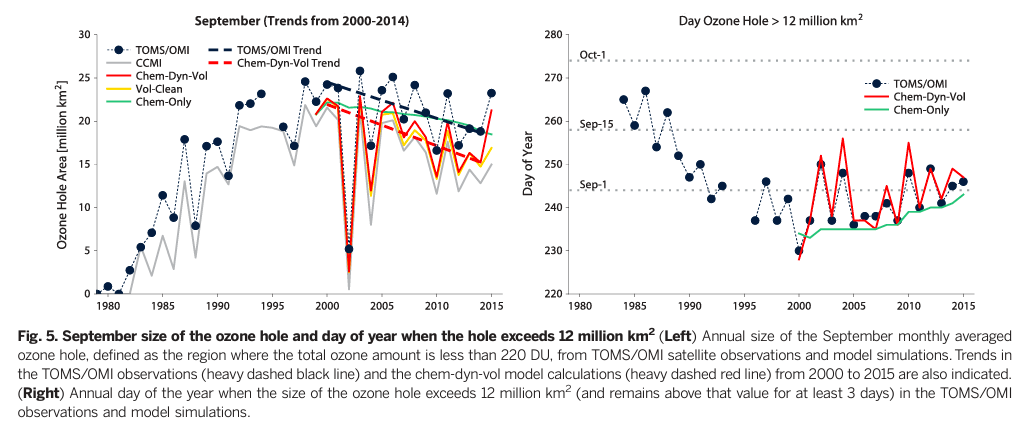


5. Read the article by Solomon et al. (2016) titled: Emergence of healing in the Antarctic ozone layer (Science, 10.1126/science.aae0061, 2016). (a) What do the authors state is the goal of this analysis, and what do they ultimately conclude? (b) Describe the measured Oz trends in Figs. 1 and 5. (c) Explain the difference between the red and green lines in Figs. 1 and 5. How do the authors interpret their difference? (d) The 1987 Montreal Protocol was tremendously successful at halting the emissions of chemicals responsible for stratospheric 03 depletion. Why then does the ozone hole persist? For example, 2015 was the fourth largest ozone hole on record. 300 Total Column 03 [DU] 400 October Fig. 1. Monthly averaged Ant- arctic total ozone column for 350 October and September, from SBUV and South Pole station observations and a series of 250 model calculations. Total ozone data measured at the 200 geographic South Pole are from CCMI Dobson observations (filled 150 -Chem-Dyn-Vol circles) for October (Top) and Chem-Only balloon sondes (open circles) 100 CCMI 85-90 S for September (Bottom), when - Chem-Dyn-Vol 85-90'S South Pole 50 there is not sufficient sunlight 1970 1975 1980 1985 1990 1995 2000 2005 2010 2015 for the Dobson. SBUV data for each month are compared with 400 model runs averaged over the September polar cap latitude band that is accessible by the instrument; 350 South Pole station data are compared with simulations for 300 85S to 90S. chan May Vol-Clean SBUV Total Column 03 (DU] windows 250 Ahm 200 150 cop 100 1970 1975 1980 1985 1990 1995 2000 2005 2010 2015 September (Trends from 2000-2014) Day Ozone Hole > 12 million km2 > 30 280 Oct-1 25 TOMS/OMI -- TOMS/OMI Trend CCMI -- Chem-Dyn-Vol Trend Chem-Dyn-Vol Vol-Clean Chem-Only 270 TOMS/OMI Chem-Dyn-Vol Chem-Only 20 260 Sep-15. Ozone Hole Area (million km?) 15 Day of Year 250 Sep-1 Metro 10 240 230 0 1980 1985 1990 1995 2000 2005 2010 220 1980 2015 1985 1990 1995 2000 2005 2010 2015 Fig. 5. September size of the ozone hole and day of year when the hole exceeds 12 million km2 (Left) Annual size of the September monthly averaged ozone hole, defined as the region where the total ozone amount is less than 220 DU, from TOMS/OMI satellite observations and model simulations. Trends in the TOMS/OMI observations (heavy dashed black line) and the chem-dyn-vol model calculations (heavy dashed red line) from 2000 to 2015 are also indicated. (Right) Annual day of the year when the size of the ozone hole exceeds 12 million km (and remains above that value for at least 3 days) in the TOMS/OMI observations and model simulations. . 5. Read the article by Solomon et al. (2016) titled: Emergence of healing in the Antarctic ozone layer (Science, 10.1126/science.aae0061, 2016). (a) What do the authors state is the goal of this analysis, and what do they ultimately conclude? (b) Describe the measured Oz trends in Figs. 1 and 5. (c) Explain the difference between the red and green lines in Figs. 1 and 5. How do the authors interpret their difference? (d) The 1987 Montreal Protocol was tremendously successful at halting the emissions of chemicals responsible for stratospheric 03 depletion. Why then does the ozone hole persist? For example, 2015 was the fourth largest ozone hole on record. 300 Total Column 03 [DU] 400 October Fig. 1. Monthly averaged Ant- arctic total ozone column for 350 October and September, from SBUV and South Pole station observations and a series of 250 model calculations. Total ozone data measured at the 200 geographic South Pole are from CCMI Dobson observations (filled 150 -Chem-Dyn-Vol circles) for October (Top) and Chem-Only balloon sondes (open circles) 100 CCMI 85-90 S for September (Bottom), when - Chem-Dyn-Vol 85-90'S South Pole 50 there is not sufficient sunlight 1970 1975 1980 1985 1990 1995 2000 2005 2010 2015 for the Dobson. SBUV data for each month are compared with 400 model runs averaged over the September polar cap latitude band that is accessible by the instrument; 350 South Pole station data are compared with simulations for 300 85S to 90S. chan May Vol-Clean SBUV Total Column 03 (DU] windows 250 Ahm 200 150 cop 100 1970 1975 1980 1985 1990 1995 2000 2005 2010 2015 September (Trends from 2000-2014) Day Ozone Hole > 12 million km2 > 30 280 Oct-1 25 TOMS/OMI -- TOMS/OMI Trend CCMI -- Chem-Dyn-Vol Trend Chem-Dyn-Vol Vol-Clean Chem-Only 270 TOMS/OMI Chem-Dyn-Vol Chem-Only 20 260 Sep-15. Ozone Hole Area (million km?) 15 Day of Year 250 Sep-1 Metro 10 240 230 0 1980 1985 1990 1995 2000 2005 2010 220 1980 2015 1985 1990 1995 2000 2005 2010 2015 Fig. 5. September size of the ozone hole and day of year when the hole exceeds 12 million km2 (Left) Annual size of the September monthly averaged ozone hole, defined as the region where the total ozone amount is less than 220 DU, from TOMS/OMI satellite observations and model simulations. Trends in the TOMS/OMI observations (heavy dashed black line) and the chem-dyn-vol model calculations (heavy dashed red line) from 2000 to 2015 are also indicated. (Right) Annual day of the year when the size of the ozone hole exceeds 12 million km (and remains above that value for at least 3 days) in the TOMS/OMI observations and model simulations


