5% significance level
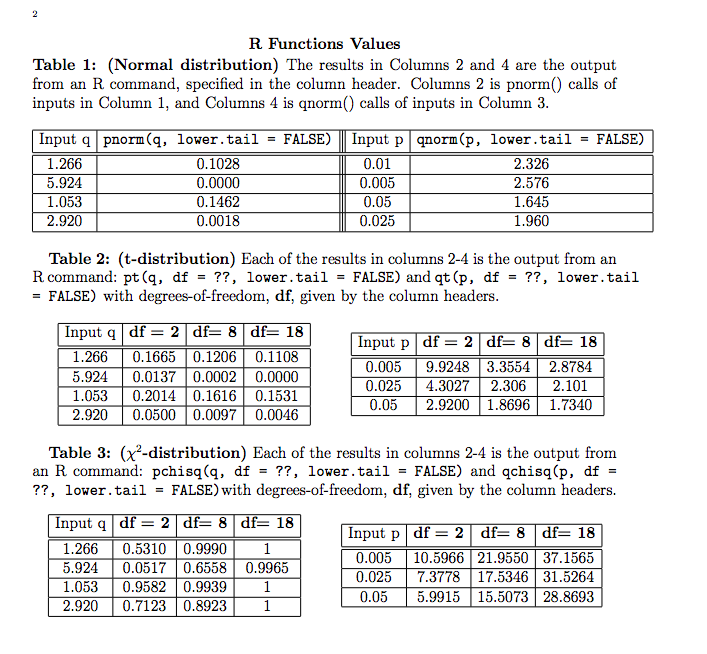
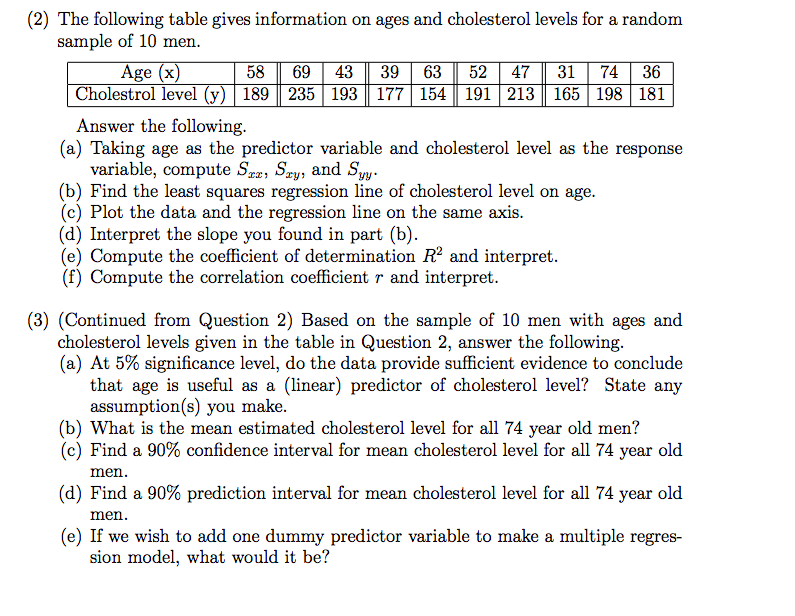
R Functions Values Table 1: (Normal distribution) The results in Columns 2 and 4 are the output from an R command, specified in the column header. Columns 2 is pnorm() calls of inputs in Column 1, and Columns 4 is qnorm() calls of inputs in Column 3. Input q pnorm (q, lower . tail = FALSE) Input p qnorm(p, lower . tail = FALSE) 1.266 0.1028 0.01 2.326 5.924 0.0000 0.005 2.576 1.053 0.1462 0.05 1.645 2.920 0.0018 0.025 1.960 Table 2: (t-distribution) Each of the results in columns 2-4 is the output from an R command: pt (q, df = ??, lower. tail = FALSE) and qt (p, df = ??, lower. tail = FALSE) with degrees-of-freedom, df, given by the column headers. Input q df = 2 df= 8 df= 18 Input p df = 2 df= 8 df= 18 1.266 0.1665 0.1206 0.1108 5.924 0.0137 0.0002 0.0000 0.005 9.9248 3.3554 2.8784 1.053 0.2014 0.1616 0.1531 0.025 4.3027 2.306 2.101 2.920 0.0500 0.0097 0.0046 0.05 2.9200 1.8696 1.7340 Table 3: (x'-distribution) Each of the results in columns 2-4 is the output from an R command: pchisq(q, df = ??, lower. tail = FALSE) and qchisq(p, df = ??, lower. tail = FALSE) with degrees-of-freedom, df, given by the column headers. Input q df = 2 df= 8 df= 18 1.266 Input p df = 2 df= 8 df= 18 0.5310 0.9990 1 5.924 0.0517 0.6558 0.9965 0.005 10.5966 21.9550 37.1565 1.053 0.9582 0.9939 0.025 7.3778 17.5346 31.5264 2.920 0.7123 0.8923 1 0.05 5.9915 15.5073 28.8693(2) The following table gives information on ages and cholesterol levels for a random sample of 10 men. Age (x) 58 69 43 39 63 52 47 31 74 36 Cholestrol level (y) 189 235 193 177 154 191 213 165 198 181 Answer the following. (a) Taking age as the predictor variable and cholesterol level as the response variable, compute Sex, Sry, and Syy. (b) Find the least squares regression line of cholesterol level on age. (c) Plot the data and the regression line on the same axis. (d) Interpret the slope you found in part (b). (e) Compute the coefficient of determination R" and interpret. (f) Compute the correlation coefficient r and interpret. (3) (Continued from Question 2) Based on the sample of 10 men with ages and cholesterol levels given in the table in Question 2, answer the following. (a) At 5% significance level, do the data provide sufficient evidence to conclude that age is useful as a (linear) predictor of cholesterol level? State any assumption(s) you make. (b) What is the mean estimated cholesterol level for all 74 year old men? (c) Find a 90% confidence interval for mean cholesterol level for all 74 year old men. (d) Find a 90% prediction interval for mean cholesterol level for all 74 year old men. (e) If we wish to add one dummy predictor variable to make a multiple regres- sion model, what would it be


