Answered step by step
Verified Expert Solution
Link Copied!

Question

1 Approved Answer

5. Suppose we have data from several economies. We know that these economies operate according to the production model we have studied. That is. in
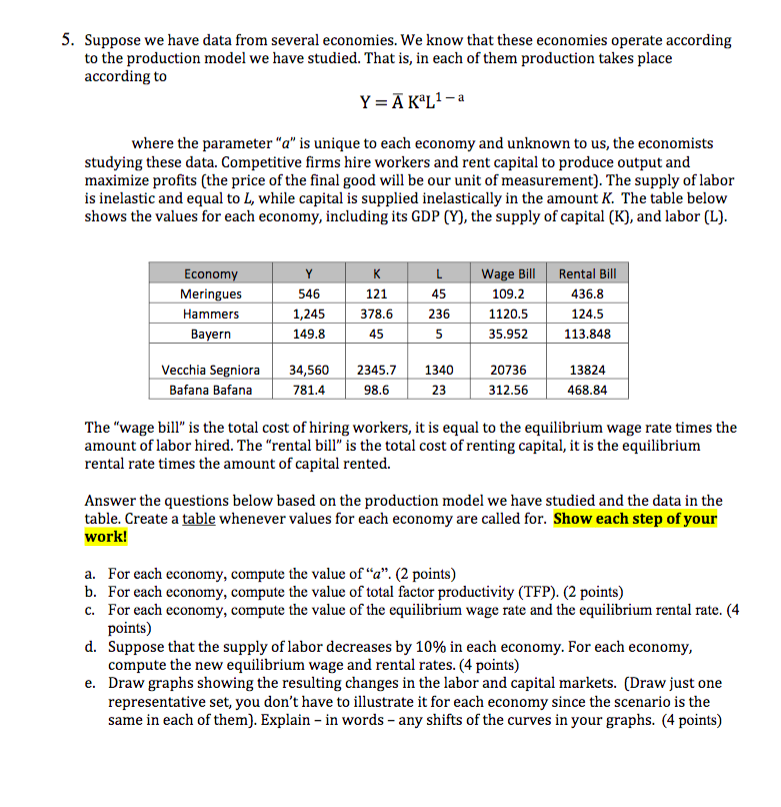
image text in transcribed
5. Suppose we have data from several economies. We know that these economies operate according to the production model we have studied. That is. in each of them production takes place according to Y=EKaL1'a where the parameter "o\" is unique to each economy and unknown to us, the economists studying these data. Competitive firms hire workers and rent capital to produce output and maximize prots [the price of the nal good will be our unit of measurement]. The supply of labor is inelastic and equal to L, while capital is supplied inelastlcally in the amount if. The table below shows the values for each economy, including its GDP {'1'}, the supply of capital (K), and labor [L]. Merln- use 121 436.3 Hammers 313.6 124.5 n--m vemhlase-niora M 1345.? m zorss issze \"m The "wage bill\" is the total cost of hiring workers, it is equal to the equilibrium wage rate times the amount of labor hired. The "rental bill\" is the total cost of renting capital, it is the equilibrium rental rate times the amount of capital rented. Answer the questions below based on the production model we have studied and the data in the table. Create a sable whenever values for each economy are called for. Show each step ofyour world a. For each economy, compute the value of \"a\". (2 points) b. For each economy, compute the value of total factor productivity [TFP]. [2 points) c. For each economy, compute the value of the equilibrium wage rate and the equilibrium rental rate. (4 points} cl. Suppose that the supply of labor decreases by 10% in each economy. For each economy, compute the new equilibrium wage and rental rates. {4 points) e. Draw graphs showing the resulting changes in the labor and capital markets. [Draw just one representative set, you don't have to illustrate it for each economy since the scenario is the same in each of them]. Explain - in words any shifts of the curves in your graphs. (4 points}

Step by Step Solution

There are 3 Steps involved in it

Step: 1

blur-text-image

Get Instant Access to Expert-Tailored Solutions

See step-by-step solutions with expert insights and AI powered tools for academic success

Step: 2

blur-text-image

Step: 3

blur-text-image

Ace Your Homework with AI

Get the answers you need in no time with our AI-driven, step-by-step assistance

Get Started

Recommended Textbook for

Principles of economics

Authors: N. Gregory Mankiw

6th Edition

978-0538453059, 9781435462120, 538453052, 1435462122, 978-0538453042

More Books

Students also viewed these Economics questions

Question

1. What is meant by Latitudes? 2. What is cartography ?

Answered: 1 week ago