

Question
5. The capital asset pricing model Nick holds a portfolio that is invested equally in three stocks. An analyst has used market- and firm-specific information
5. The capital asset pricing model
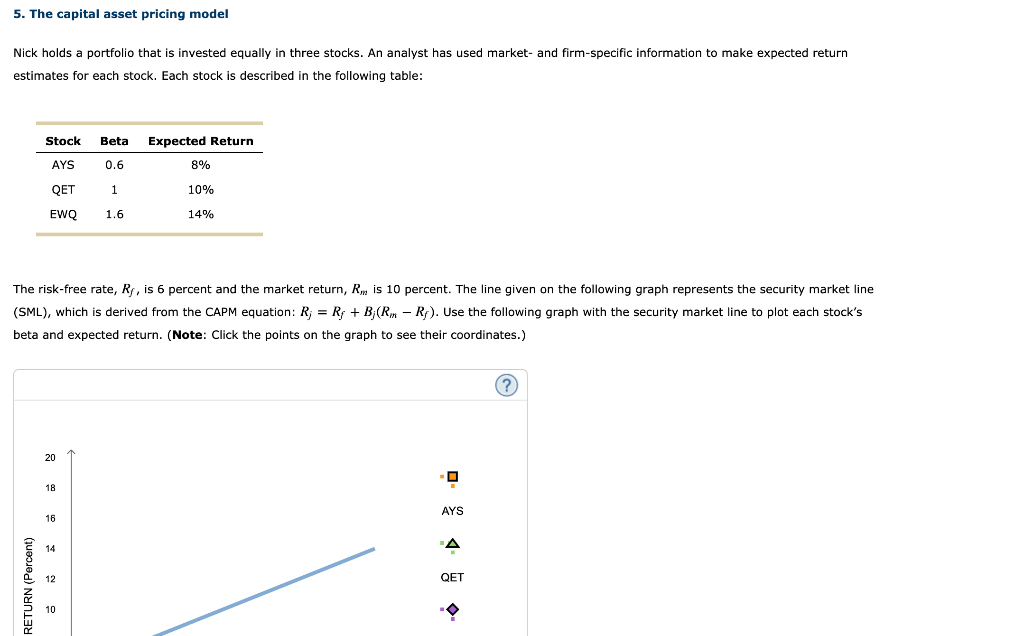
Nick holds a portfolio that is invested equally in three stocks. An analyst has used market- and firm-specific information to make expected return estimates for each stock. Each stock is described in the following table:
| Stock | Beta | Expected Return |
|---|---|---|
| AYS | 0.6 | 8% |
| QET | 1 | 10% |
| EWQ | 1.6 | 14% |
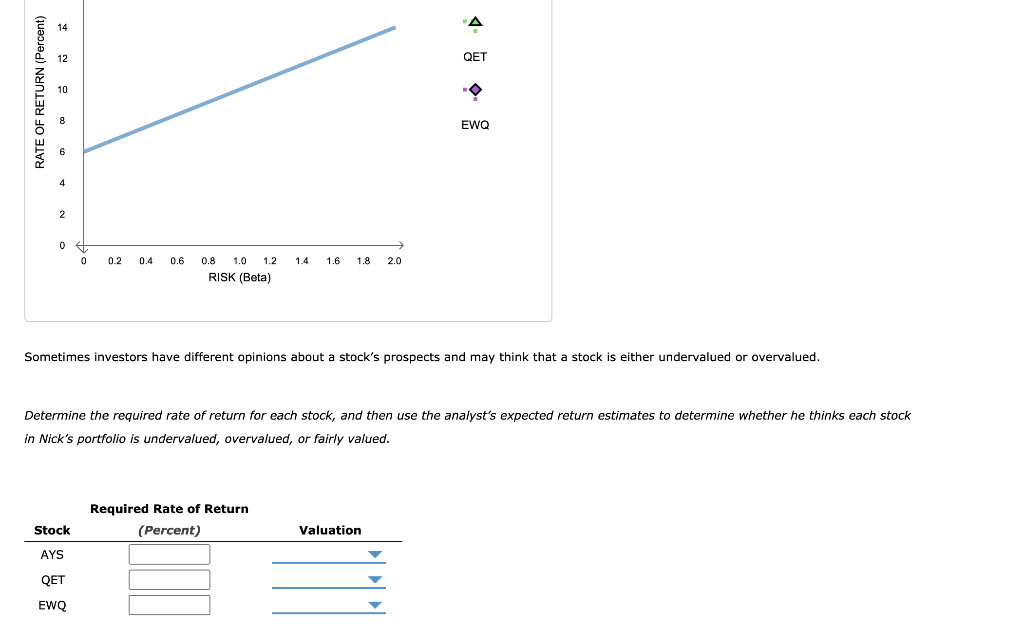
The risk-free rate, RfRf, is 6 percent and the market return, RmRm is 10 percent. The line given on the following graph represents the security market line (SML), which is derived from the CAPM equation: Rj=Rf+Bj(RmRf)Rj=Rf+Bj(RmRf). Use the following graph with the security market line to plot each stocks beta and expected return. (Note: Click the points on the graph to see their coordinates.)
AYSQETEWQ00.20.40.60.81.01.21.41.61.82.020181614121086420RATE OF RETURN (Percent)RISK (Beta)2, 16Y-Intercept: 6Slope: 4
Sometimes investors have different opinions about a stocks prospects and may think that a stock is either undervalued or overvalued.
Determine the required rate of return for each stock, and then use the analysts expected return estimates to determine whether he thinks each stock in Nicks portfolio is undervalued, overvalued, or fairly valued.
| Stock | Required Rate of Return | Valuation |
|---|---|---|
| (Percent) | ||
| AYS |
| |
| QET |
| |
| EWQ |
|
Step by Step Solution
There are 3 Steps involved in it
Step: 1

Get Instant Access to Expert-Tailored Solutions
See step-by-step solutions with expert insights and AI powered tools for academic success
Step: 2

Step: 3
Ace Your Homework with AI
Get the answers you need in no time with our AI-driven, step-by-step assistance
Get Started
Options Trading For Beginners How To Generate Predictable Income And Make A Living Without Taking Big Risks Even If You Re A Complete Beginner
Authors: Greg Middleton
1st Edition
979-8866955046