

Answered step by step
Verified Expert Solution
Question
1 Approved Answer
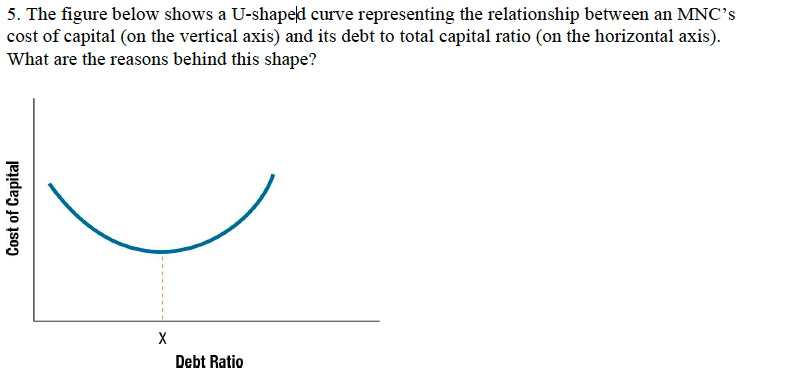
5. The figure below shows a U-shaped curve representing the relationship between an MNC's cost of capital (on the vertical axis) and its debt to
Step by Step Solution
There are 3 Steps involved in it
Step: 1

Get Instant Access to Expert-Tailored Solutions
See step-by-step solutions with expert insights and AI powered tools for academic success
Step: 2

Step: 3
Ace Your Homework with AI
Get the answers you need in no time with our AI-driven, step-by-step assistance
Get Started
Managing Finance
Authors: CMI Books
1st Edition
1781252181, 978-1781252185