

Answered step by step
Verified Expert Solution
Question
1 Approved Answer
5. The figure below shows the ACFs for 36 random numbers, 360 random numbers and 1,000 random numbers. Explain the differences among these figures. Do
5. The figure below shows the ACFs for 36 random numbers, 360 random numbers and 1,000 random numbers.
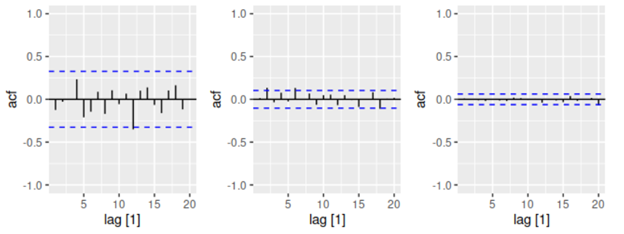
Explain the differences among these figures. Do they all indicate that the data are white noise?
1.0- 1.0- 1.0- 0.5 - 0.5- 0.5- 0.0 4 500=12E 300 == -0.5 - -0.5 - -0.5 - -1.0 - -1.0 - -1.0 - UN- 20 20 15 20 10 15 lag (1) 10 15 lag (1) 10 lag (1) 1.0- 1.0- 1.0- 0.5 - 0.5- 0.5- 0.0 4 500=12E 300 == -0.5 - -0.5 - -0.5 - -1.0 - -1.0 - -1.0 - UN- 20 20 15 20 10 15 lag (1) 10 15 lag (1) 10 lag (1)Step by Step Solution
There are 3 Steps involved in it
Step: 1

Get Instant Access to Expert-Tailored Solutions
See step-by-step solutions with expert insights and AI powered tools for academic success
Step: 2

Step: 3
Ace Your Homework with AI
Get the answers you need in no time with our AI-driven, step-by-step assistance
Get Started
Bakers Health Care Finance Basic Tools For Nonfinancial Managers
Authors: Thomas K. Ross
6th Edition
1284233162, 978-1284233162