

Question: Quantitative Problem: Rosnan Industries' 2019 and 2018 balance sheets and income statements are shown below. Balance Sheets 2019 2018 $100 275 375 $85 300 250
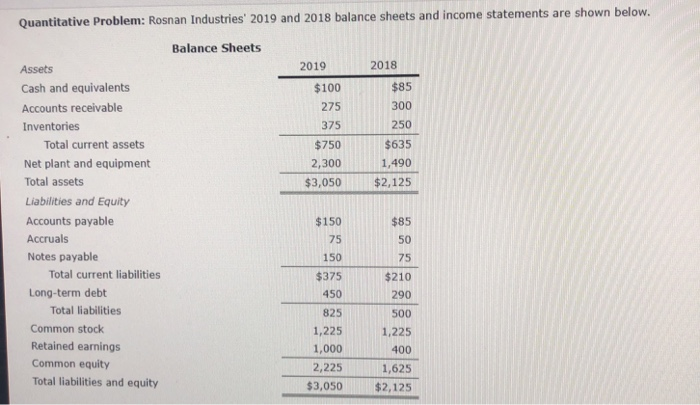
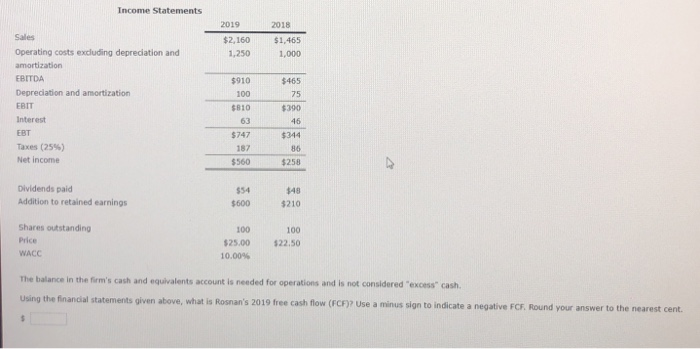
Quantitative Problem: Rosnan Industries' 2019 and 2018 balance sheets and income statements are shown below. Balance Sheets 2019 2018 $100 275 375 $85 300 250 $635 1,490 $2,125 $750 2,300 $3,050 Assets Cash and equivalents Accounts receivable Inventories Total current assets Net plant and equipment Total assets Liabilities and Equity Accounts payable Accruals Notes payable Total current liabilities Long-term debt Total liabilities Common stock Retained earnings Common equity Total liabilities and equity $150 75 $85 50 150 75 $210 290 500 $375 450 825 1,225 1,000 2,225 $3,050 1,225 400 1,625 $2,125 Income Statements 2019 Sales 2018 $1,465 1,000 $2,160 1,250 Operating costs excluding depreciation and amortization EBITDA Depreciation and amortization $910 100 $810 63 EBIT Interest $465 75 $390 46 $344 86 $258 EBT $747 187 Taxes (25%) Net Income $560 $54 Dividends paid Addition to retained earnings $600 $48 $210 Shares outstanding Price WACC 100 $25.00 10.00% 100 $22.50 The balance in the firm's cash and equivalents account is needed for operations and is not considered "excess" cash Using the financial statements given above, what is Rosnan's 2019 free cash flow (FCF)? Use a minus sign to indicate a negative FCF. Round your answer to the nearest cent
Step by Step Solution
There are 3 Steps involved in it
To determine Rosnan Industries 2019 Free Cash Flow FCF we will follow these steps 1 Calculate the op... View full answer

Get step-by-step solutions from verified subject matter experts