Question
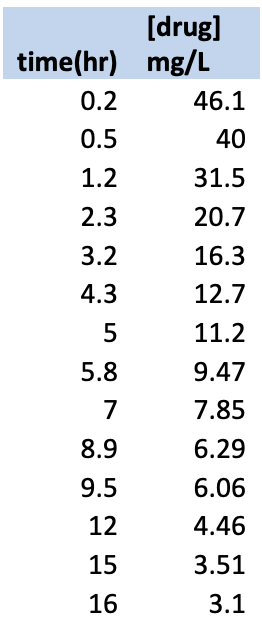
5. The following plasma drug concentration data has been given to you. a. Plot this data on both linear-linear and log-linear plots, labeling clearly. b.
5. The following plasma drug concentration data has been given to you.
a. Plot this data on both linear-linear and log-linear plots, labeling clearly.
b. Should this model be fitted with a one, two, or three-compartment model? Please justify using residuals/standard error and reason, and plot your final fit along with the original data. Give fit parameters.
c. Tell us more about the drug from the data. Was it most likely oral, or iv injection? Are there different phases, and what would those phases represent?
d. Estimate the initial plasma concentration at t=0, and explain how you got that.

Step by Step Solution
There are 3 Steps involved in it
Step: 1

Get Instant Access to Expert-Tailored Solutions
See step-by-step solutions with expert insights and AI powered tools for academic success
Step: 2

Step: 3

Ace Your Homework with AI
Get the answers you need in no time with our AI-driven, step-by-step assistance
Get Started


