Answered step by step
Verified Expert Solution
Link Copied!

Question

1 Approved Answer

5) The following tables shows the results of a survey given to 150 statistics students. The table shows how often a student did their homework
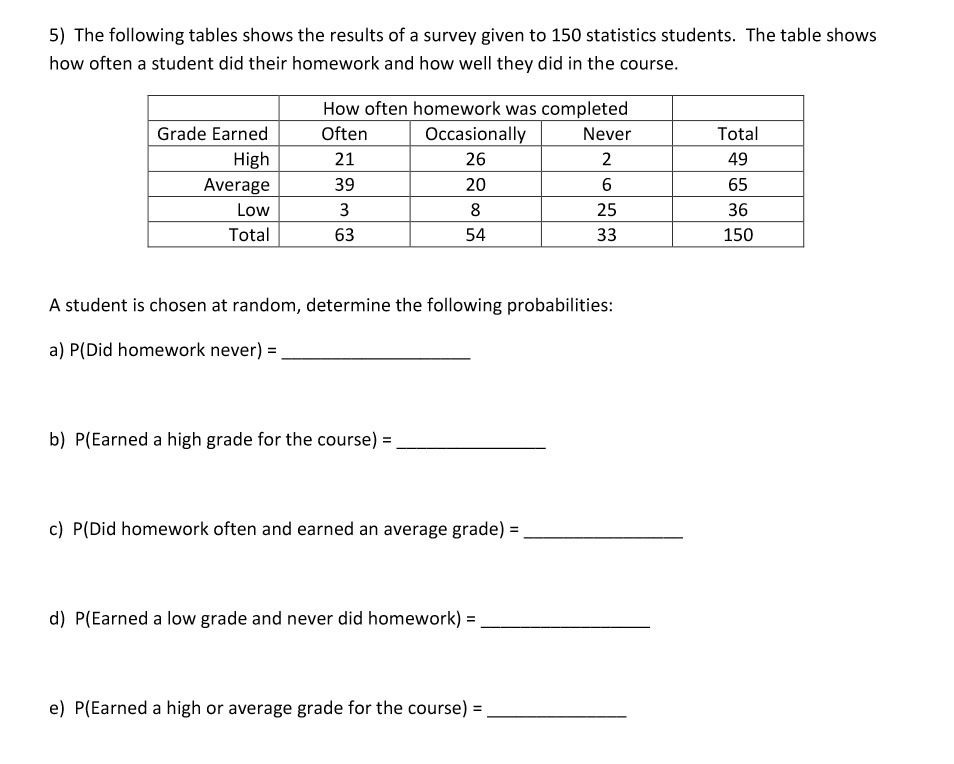
image text in transcribed
5) The following tables shows the results of a survey given to 150 statistics students. The table shows how often a student did their homework and how well they did in the course. How often homework was completed Grade Earned Often Occasionally Never Total High 21 26 2 49 Average 39 20 6 65 Low 3 8 25 36 Total 63 54 33 150 A student is chosen at random, determine the following probabilities: a) P(Did homework never) = b) P(Earned a high grade for the course) = c) P(Did homework often and earned an average grade) = d) P(Earned a low grade and never did homework) = e) P(Earned a high or average grade for the course) =

Step by Step Solution

There are 3 Steps involved in it

Step: 1

blur-text-image

Get Instant Access to Expert-Tailored Solutions

See step-by-step solutions with expert insights and AI powered tools for academic success

Step: 2

blur-text-image_2

Step: 3

blur-text-image_3

Ace Your Homework with AI

Get the answers you need in no time with our AI-driven, step-by-step assistance

Get Started

Recommended Textbook for

Derivatives Markets

Authors: Robert McDonald

3rd Edition

978-9332536746, 9789332536746

Students also viewed these Mathematics questions