

Answered step by step
Verified Expert Solution
Question
1 Approved Answer
5. The two pie charts show the proportion of each expense type for both the contribution format and traditional format. Pie charts can be especially
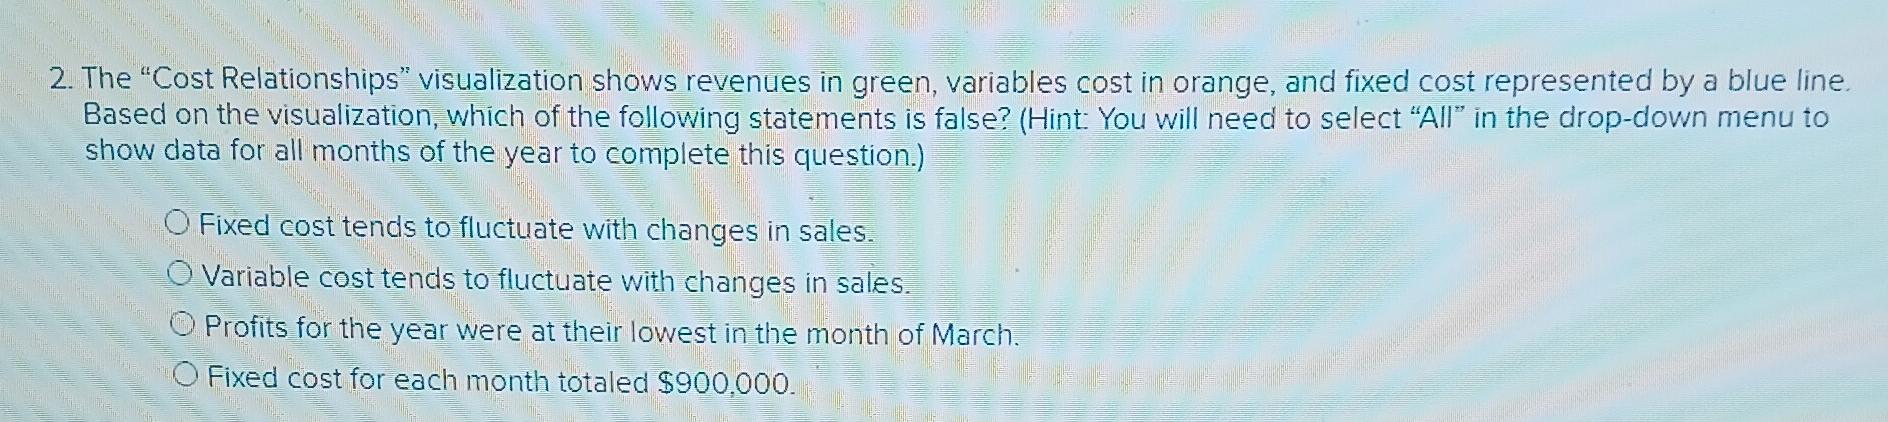

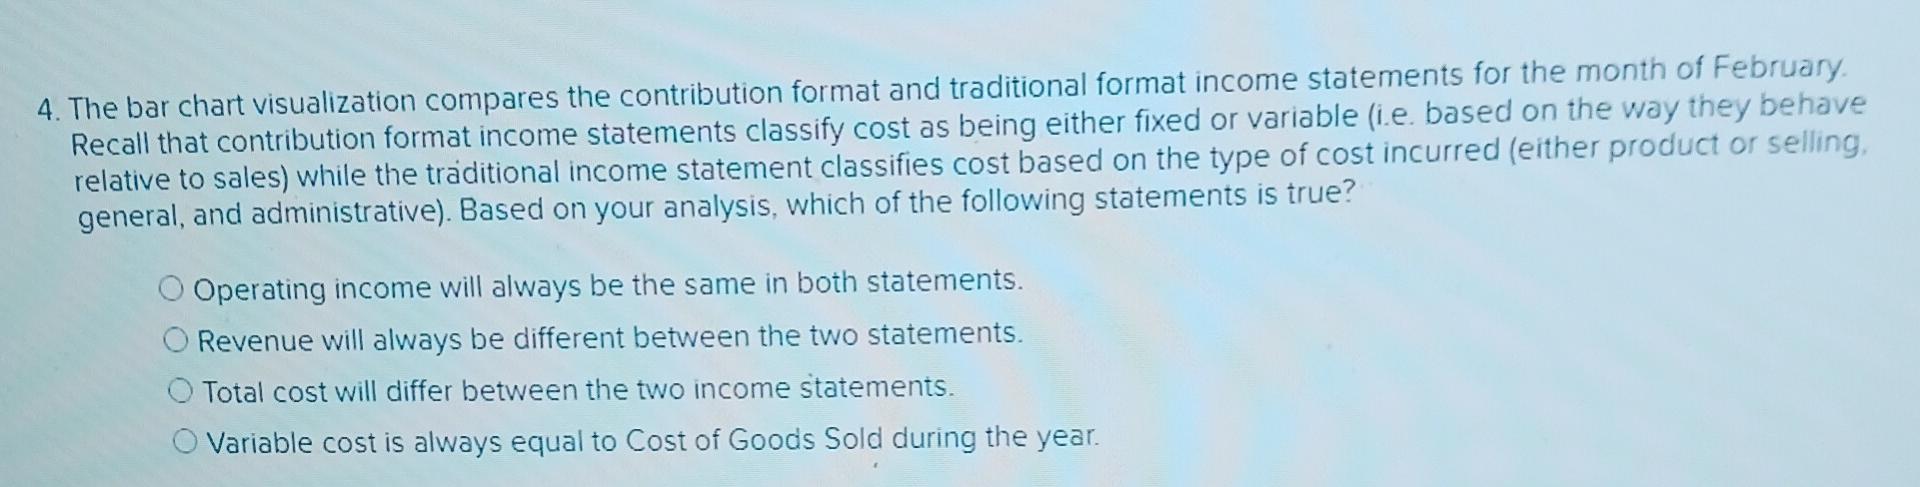
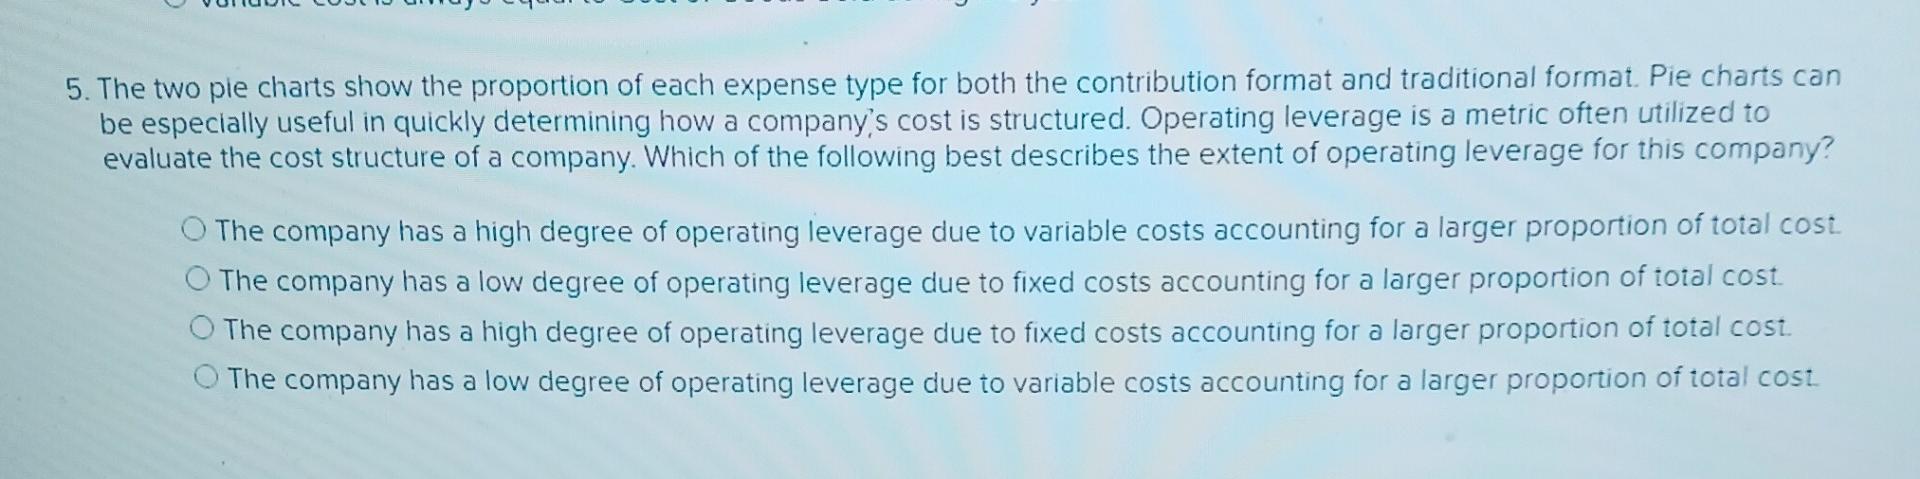
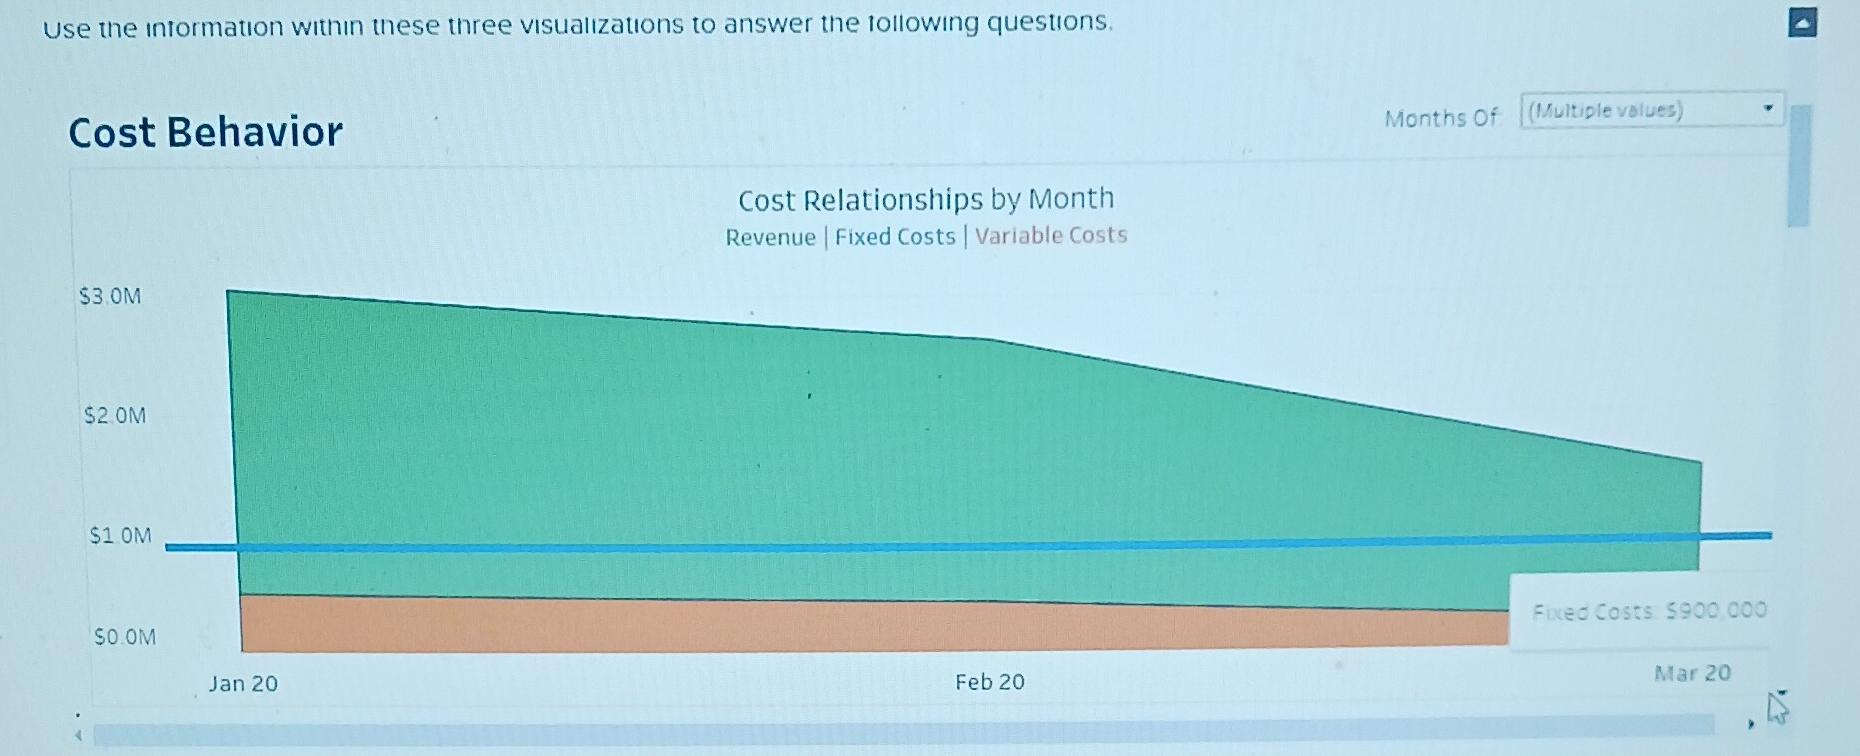
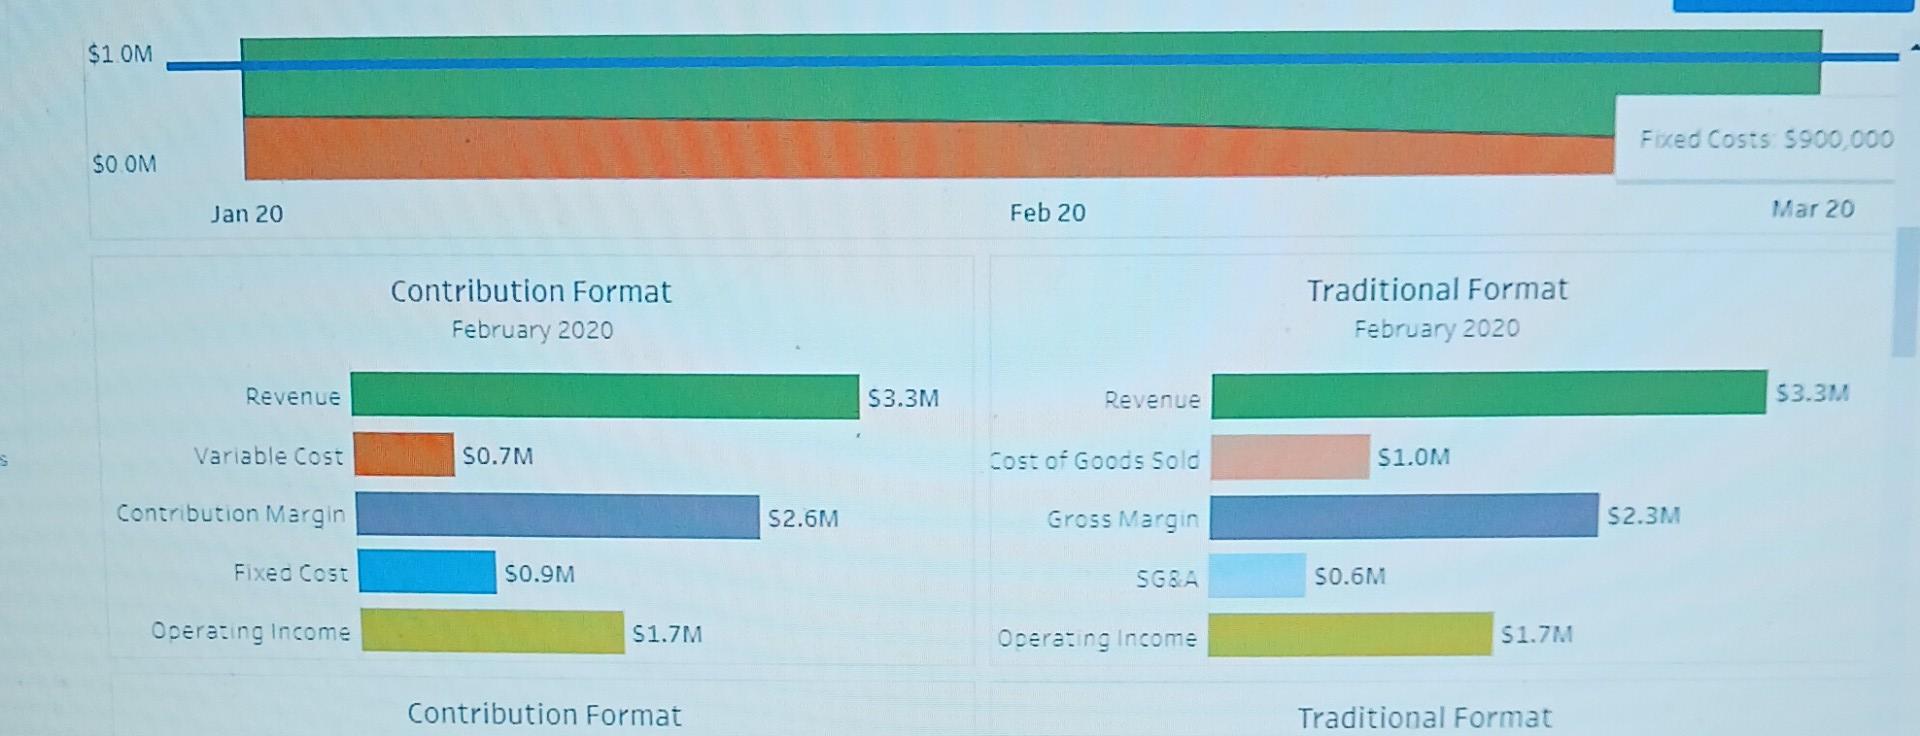

5. The two pie charts show the proportion of each expense type for both the contribution format and traditional format. Pie charts can be especially useful in quickly determining how a company's cost is structured. Operating leverage is a metric often utilized to evaluate the cost structure of a company. Which of the following best describes the extent of operating leverage for this company? The company has a high degree of operating leverage due to variable costs accounting for a larger proportion of total cost. The company has a low degree of operating leverage due to fixed costs accounting for a larger proportion of total cost. The company has a high degree of operating leverage due to fixed costs accounting for a larger proportion of total cost. The company has a low degree of operating leverage due to variable costs accounting for a larger proportion of total cost. 3. In which month did the company earn the least amount of revenue? January March July September use the intormation withn these three visualzations to answer the tollowing questions. 2. The "Cost Relationships" visualization shows revenues in green, variables cost in orange, and fixed cost represented by a blue line. Based on the visualization, which of the following statements is false? (Hint: You will need to select "All" in the drop-down menu to show data for all months of the year to complete this question.) Fixed cost tends to fluctuate with changes in sales. Variable cost tends to fluctuate with changes in sales. Profits for the year were at their lowest in the month of March. Fixed cost for each month totaled $900,000. 4. The bar chart visualization compares the contribution format and traditional format income statements for the month of February. Recall that contribution format income statements classify cost as being either fixed or variable (i.e. based on the way they behave relative to sales) while the traditional income statement classifies cost based on the type of cost incurred (either product or selling. general, and administrative). Based on your analysis, which of the following statements is true? Operating income will always be the same in both statements. Revenue will always be different between the two statements. Total cost will differ between the two income statements. Variable cost is always equal to Cost of Goods Sold during the year. +ableau
Step by Step Solution
There are 3 Steps involved in it
Step: 1

Get Instant Access to Expert-Tailored Solutions
See step-by-step solutions with expert insights and AI powered tools for academic success
Step: 2

Step: 3
Ace Your Homework with AI
Get the answers you need in no time with our AI-driven, step-by-step assistance
Get Started
The Only Tax Audit Guide Youll Ever Need
Authors: Janet M. Sydlaske, Richard K. Millcroft
1st Edition
0471510769, 978-0471510765