

Answered step by step
Verified Expert Solution
Question
1 Approved Answer
5 Universal Electronics is considering the purchase of manufacturing equipment with a 10-year midpoint in its asset depreciation range (ADR). Carefully refer to Table 12-11
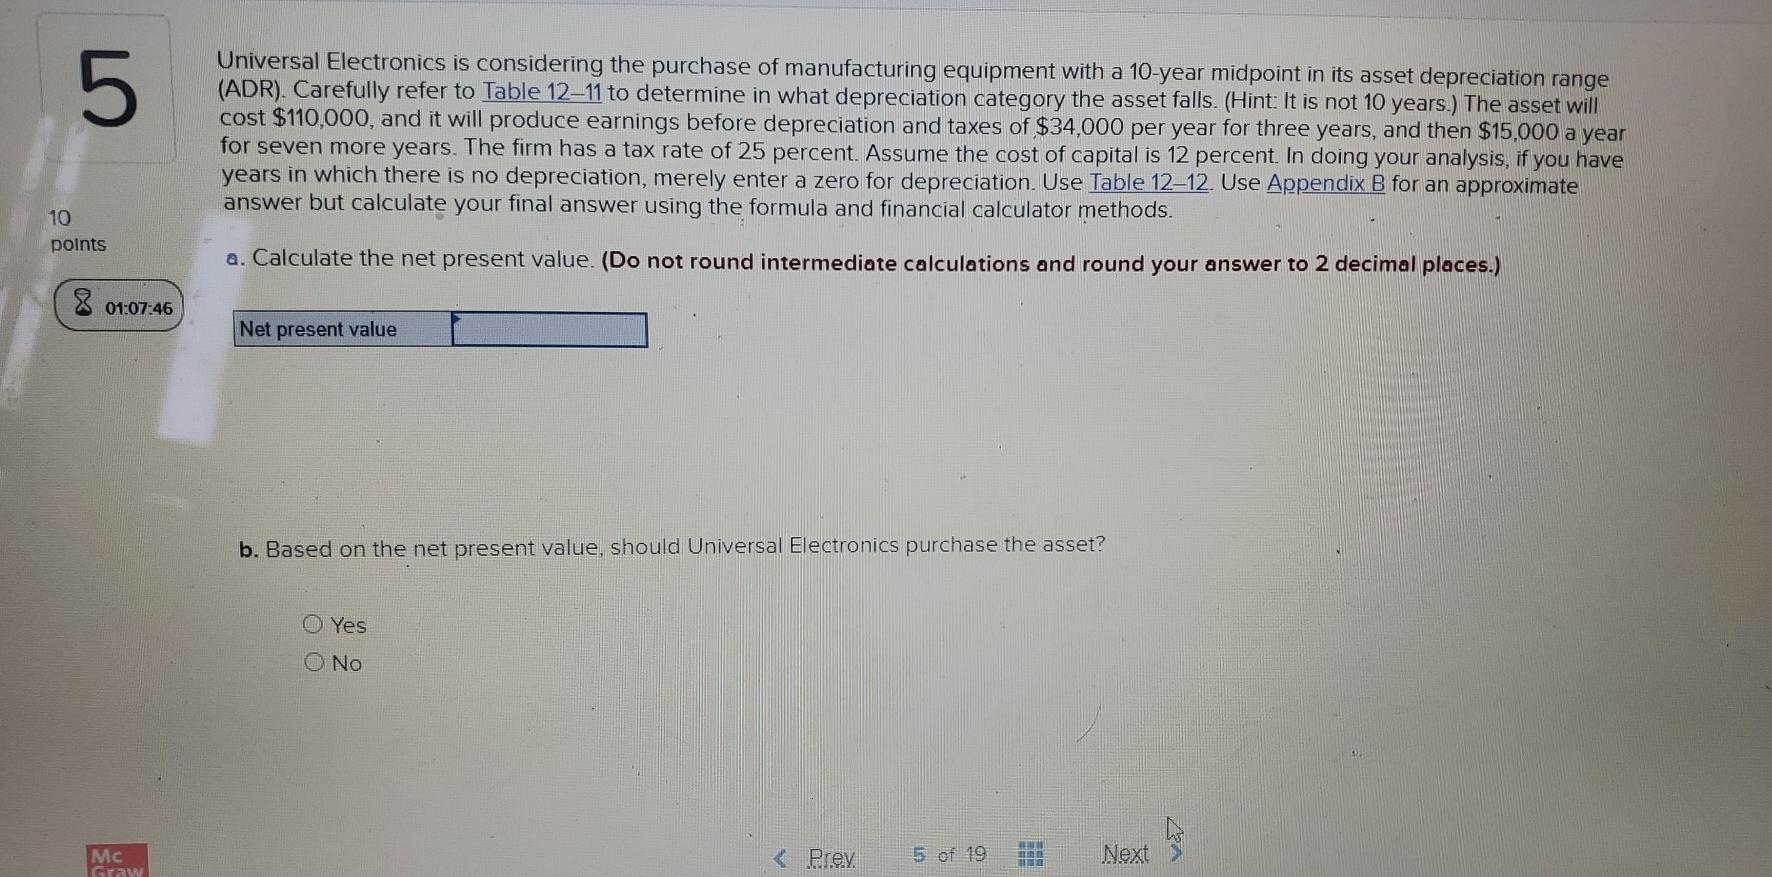
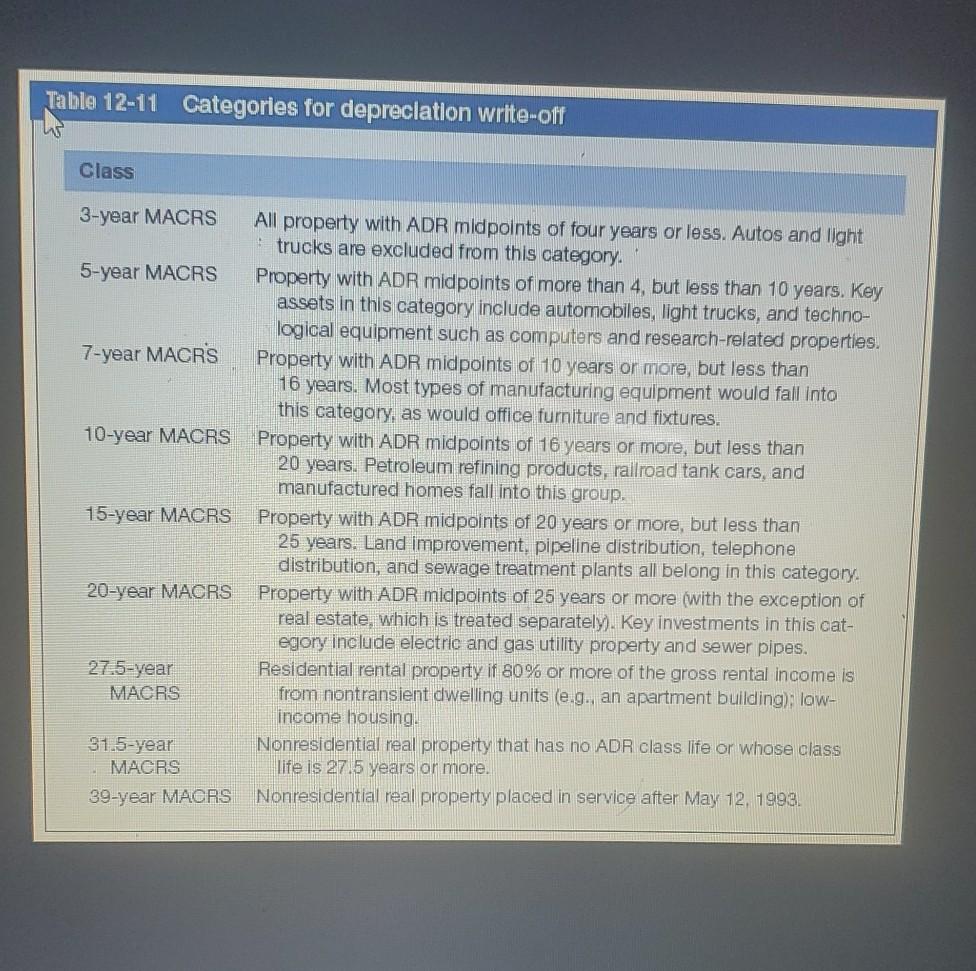
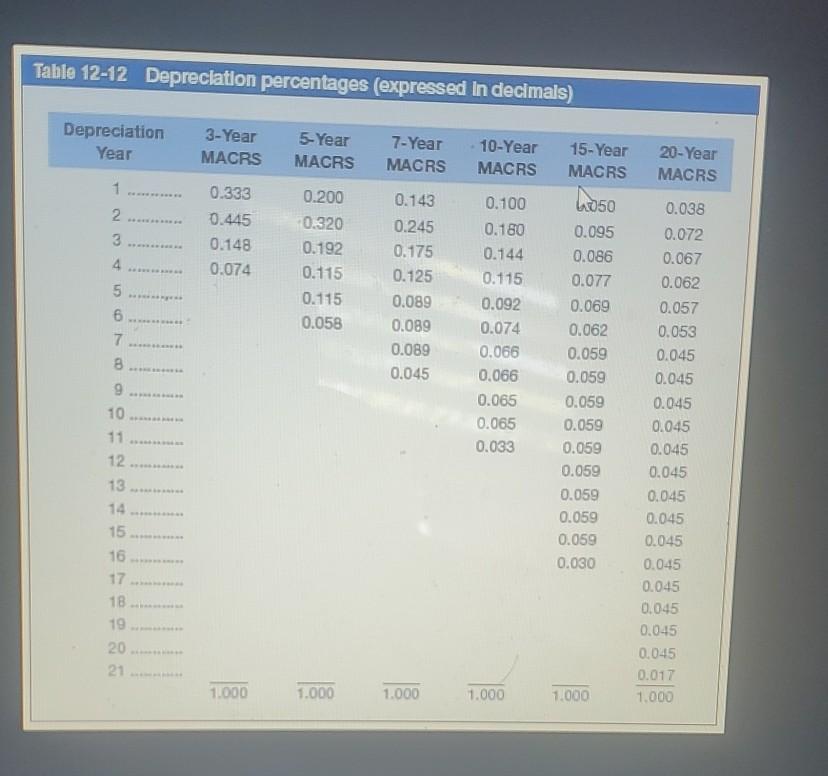
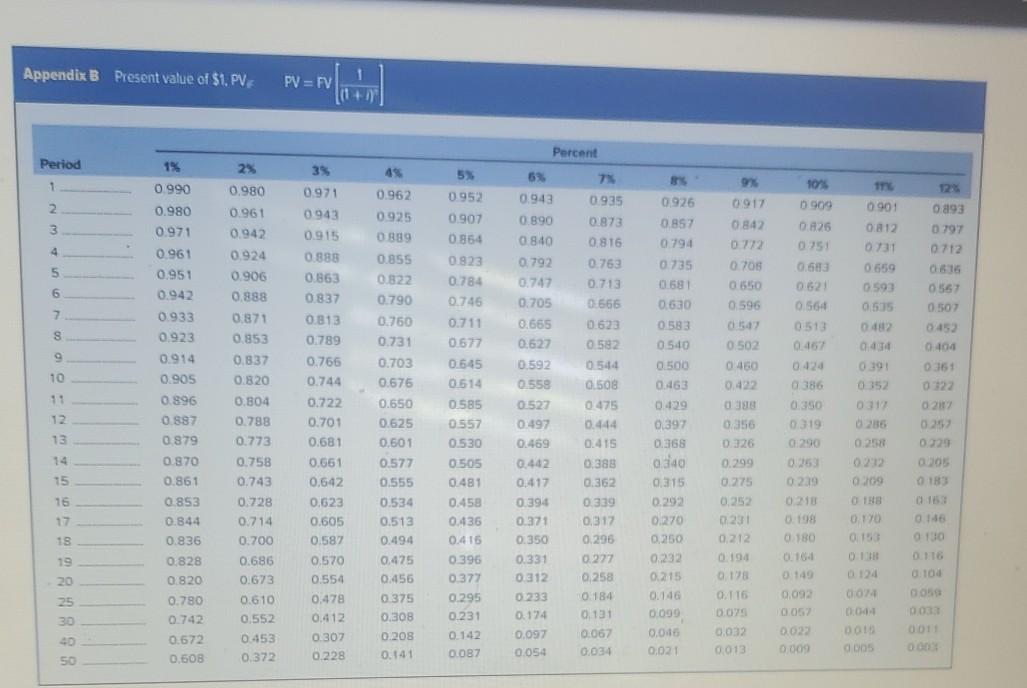
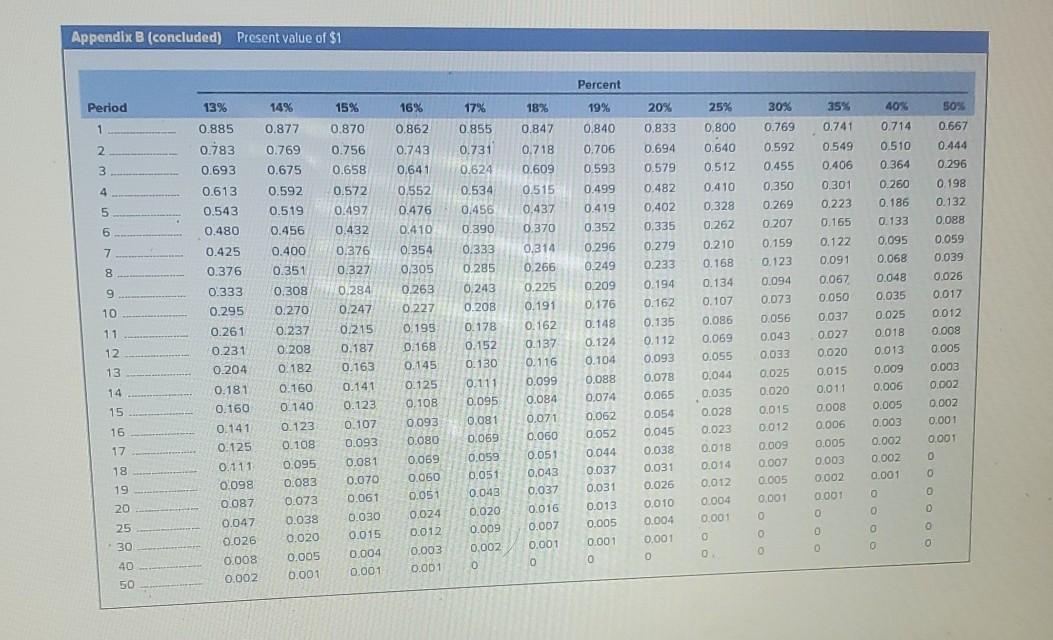
5 Universal Electronics is considering the purchase of manufacturing equipment with a 10-year midpoint in its asset depreciation range (ADR). Carefully refer to Table 12-11 to determine in what depreciation category the asset falls. (Hint: It is not 10 years.) The asset will cost $110,000, and it will produce earnings before depreciation and taxes of $34,000 per year for three years, and then $15,000 a year for seven more years. The firm has a tax rate of 25 percent. Assume the cost of capital is 12 percent. In doing your analysis, if you have years in which there is no depreciation, merely enter a zero for depreciation. Use Table 1212. Use Appendix B for an approximate answer but calculate your final answer using the formula and financial calculator methods. 10 points a. Calculate the net present value. (Do not round intermediate calculations and round your answer to 2 decimal places.) 8 01:07:46 Net present value b. Based on the net present value, should Universal Electronics purchase the asset? O Yes Mc Graw Prey. 5 of 19 Next ta Table 12-11 Categories for depreclation write-off ws Class 3-year MACRS All property with ADR midpoints of four years or less. Autos and light trucks are excluded from this category. 5-year MACRS Property with ADR midpoints of more than 4, but less than 10 years. Key assets in this category include automobiles, light trucks, and techno- logical equipment such as computers and research-related properties. 7-year MACRS Property with ADR midpoints of 10 years or more, but less than 16 years. Most types of manufacturing equipment would fall into this category, as would office furniture and fixtures. 10-year MACRS Property with ADR midpoints of 16 years or more, but less than 20 years. Petroleum refining products, railroad tank cars, and manufactured homes fall into this group. 15-year MACRS Property with ADR midpoints of 20 years or more, but less than 25 years. Land improvement, pipeline distribution, telephone distribution, and sewage treatment plants all belong in this category. 20-year MACRS Property with ADR midpoints of 25 years or more (with the exception of real estate, which is treated separately. Key investments in this cat- egory include electric and gas utility property and sewer pipes. 27.5-year Residential rental property if 80% or more of the gross rental income is MACRS from nontransient dwelling units (e.g., an apartment building, low- income housing. 31.5-year Nonresidential real property that has no ADR class life or whose class MACRS Tife is 2715 years or more. 39-year MACRS Nonresidential real property placed in service after May 12, 1993 Table 12-12 Depreciation percentages (expressed In decimals) Depreciation Year 3-Year MACRS 5-Year MACRS 7-Year MACRS 10-Year MACRS 15-Year MACRS 20-Year MACRS 1 0.100 2 3 4 0.333 0.445 0.148 0.074 0.200 0.320 0.192 0.115 0.115 0.058 5 0.143 0.245 0.175 0.125 0.089 0.089 0.089 0.045 6 7 0.180 0.144 0.115 0.092 0.074 0.066 0.066 0.065 0.065 0.033 B 9 10 11 W050 0.095 0.086 0.077 0.069 0.062 0.059 0.059 0.059 0.059 0.059 0.059 0.059 0.059 0.059 0.030 0.038 0.072 0.067 0.062 0.057 0.053 0.045 0.045 0.045 0.045 0.045 0.045 0.045 0.045 0.045 0.045 0.045 0.045 0.045 0.045 0.017 1.000 12 ... 13 .... 14 ....- 15 16 17 - 18 19 20 21 1.000 1.000 1.000 1.000 1.000 Appendix B Present value of $1. PV PV = FV Percent Period 1 3% 0.971 0943 0.915 7% 0.935 0.873 2 3 0893 0797 0712 9180 4 8880 5 9 0.962 0925 0999 0.855 0.822 0.790 0.750 0.731 0.703 0.676 0.550 0.625 0616 0567 0.500 97 0.917 0842 0.772 0.705 0.650 0596 0542 0.502 0460 0.422 0.901 0212 0731 0.559 0.593 05:35 0.482 0.434 7 s 5 0.952 0.907 0854 0923 0.784 0.746 0.711 0677 0.645 0514 0.585 0.557 0.530 0.505 0.481 1% 0.990 0.980 0.971 0.96 0.951 0.942 0.933 0.923 0.914 0.905 0.896 0.887 0.879 0.870 0.861 0.853 0.844 0.836 0.828 0.820 0.780 CSPO 0.926 0.857 0794 0.735 0.691 0.630 0.583 0.540 0.500 0.463 0.429 0.397 0.368 S 0 2% 0.980 0.961 0.942 0.924 0.906 0.888 0.871 0.853 0.837 0.820 0.804 0.788 0.773 0.758 0.743 0.728 0.714 0.700 0.686 0.673 0.610 0.552 100% 0.909 0.825 0.251 0.683 0621 0564 01513 0.467 0.424 0386 0.350 01319 01290 0.763 0.713 0566 0.623 0.582 0544 0.508 0475 0.444 0.415 16EO 10 53 0.943 0.990 0840 0.792 0.747 0.705 0.665 0.627 0.592 0.558 0.527 0.497 0.469 0.442 0.417 0.394 0.37 0.350 0.331 0312 01233 0.174 0.863 0837 0.813 0.789 0.766 0.744 0.722 0.701 0.681 0.661 0.642 0.623 0.605 0.587 0.570 0.554 11 0.152 0.17 BBED 0404 0151 0322 0.217 0.25 0.229 0305 12 0286 13 . 0.601 0.258 14 OPED CEZO 0.388 0.362 15 0.356 0.326 0.299 0.275 0.252 0231 0.212 0.239 CRIO 16 0.577 0.555 0.534 0.513 0.494 0.475 0.455 17 15 0109 OTHB 0170 0153 0.339 0.317 0.295 0.227 0.258 0.458 0.436 0.416 0.396 0377 0.295 0.231 19 0.315 0.292 0.270 0.250 0.232 0.215 0.146 0.099 0.000 0,021 0198 0 180 0.164 0149 0.092 0194 0.18 0.116 20 0124 0146 0 130 ORG 0.100 0050 003 OOT 000 25 0.184 ZOO 2500 8 8 8 8 30 0.742 0.478 0.412 0.307 0.228 0 375 0.308 0.208 0.141 0.097 0.142 0.02 0.044 DOO 0.005 0.131 0.067 0.034 0.672 0.500 D 0.453 0.372 0.032 0.013 6000 0.054 50 0.087 Appendix B (concluded) Present value of $1 Percent Period 13% 14% 15% 16% 17% 18% 19% 20% 35% 50% 30% 0.769 40% 0.714 1 0.870 0.862 0.667 0.877 0.769 0.675 0.855 0.731 0.833 0.694 2 0.847 10.718 0.609 25% 0.800 0.640 0.512 0.756 0.658 0.592 0.455 0.444 0.296 3 0.840 0.706 0.593 0.499 0.419 0.624 0.885 0.783 0.693 0.613 0.543 0.480 4 4 0.572 0.743 0.641 0.552 0.476 0.410 0.354 0,305 0.592 0.519 0.456 0.510 0.364 0.260 0.186 0.133 0.534 0.456 0.579 0.482 0,402 0.410 0,328 0.515 0.437 0.370 5 0.350 0.269 0.207 0.497 0.741 0.549 0.406 0.301 0.223 0.165 0.122 0.091 0.067 0.050 0.198 0.132 0.088 6 0.432 0.335 0.890 7 0.425 0.333 0.400 0.351 0.059 0.039 0.159 0.123 0.352 0.296 0.249 0.209 0.176 8 0.376 0.285 0.026 0.017 9 0.308 0.270 0,243 0.208 10 11 0.262 0.210 0.168 0.134 0.107 0.085 0.069 0.055 0.044 0.035 0.237 0.208 0.376 0.327 0.284 0.247 0.215 0.187 0.163 0.141 0.123 0.107 0.093 0.178 0.152 0.130 12 13 0.094 0.073 0.056 0.043 0.033 0.025 0.020 0.015 0.012 0.182 14 0.333 0.295 0.261 0.231 0.204 0.181 0.160 0.141 0.125 0.111 0.098 0.087 0.047 0.026 0.008 0.002 0.095 0.068 0.048 0.035 0.025 0.01B 0.013 0.009 0.006 0.005 0.003 0.002 0.002 0.001 0.314 0.266 0.225 0.191 0.162 0.137 0.116 0.099 0.084 0.071 0.060 0.051 0,043 0.037 0.016 0.007 0.001 0 0.263 0.227 0.195 0.168 0.145 0.125 0.108 0.093 0.080 0.069 0.060 0.051 0.024 0.012 0.003 0.001 0.279 0.233 0.194 0.162 0.135 0.112 0.093 0.078 0.065 0.054 0.045 0.038 0.031 0.026 0.010 0.004 0.001 15 16 0.148 0.124 0.104 0.088 0.074 0.062 0.052 0.044 0.037 0.031 0.013 0.005 0.001 0.160 0.140 0.123 0.108 0.095 0.083 0.073 0.038 0.020 0.005 0.001 0.012 0.008 0.005 0.003 0.002 0.002 0.001 0.001 0 0 0.111 0.095 0.081 0.069 0.059 0.051 0.043 0.020 0.009 0.037 0.027 0.020 0.015 0.011 0.008 0.006 0.005 0.003 0.002 0.001 0 0 0 17 18 0.028 0.023 0.018 0.014 0.012 0.004 0.001 0 0 0.009 0.007 0.005 0.001 0 19 0.081 0.070 0.061 0.030 0.015 0.004 0.001 0 -20 D 25 @ 0 30 0 0.002 0 40 0 50
Step by Step Solution
There are 3 Steps involved in it
Step: 1

Get Instant Access to Expert-Tailored Solutions
See step-by-step solutions with expert insights and AI powered tools for academic success
Step: 2

Step: 3
Ace Your Homework with AI
Get the answers you need in no time with our AI-driven, step-by-step assistance
Get Started
Professionals Handbook Of Financial Risk Management
Authors: Lev Borodovsky, Marc Lore
1st Edition
0750641118, 978-0750641111