

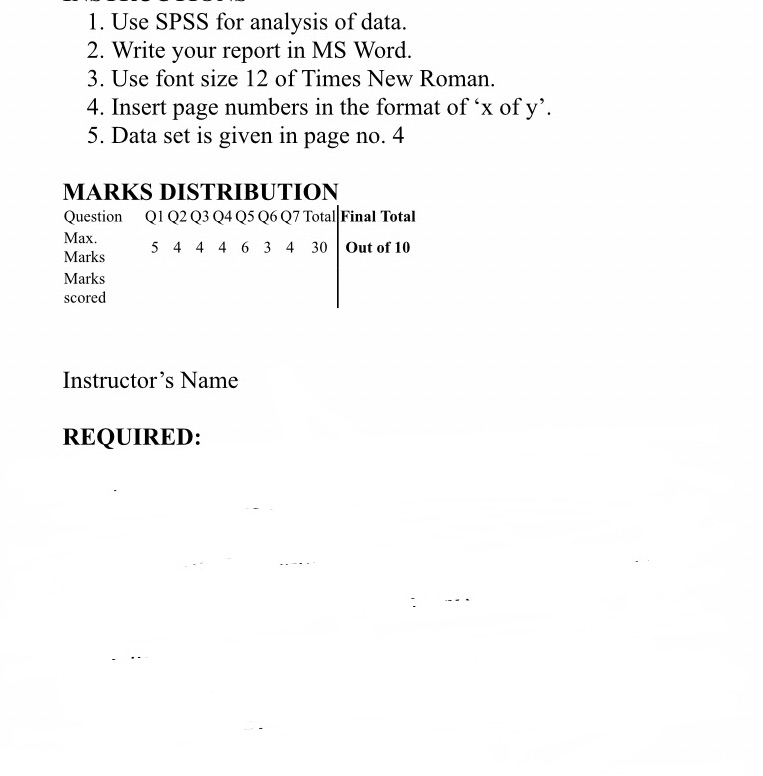
Question
5. Use Q3 (Age) to introduce a new variable as per the details given below: Name of the new variable as 'Age Group'. Young: Less
5. Use Q3 (Age) to introduce a new variable as per the details given below: Name of the new variable as 'Age Group'. Young: Less than 25 years Middle age : 25 to less than 45 years senior : 45 year than above 6. : 45 years (Marks6) Find the frequency distribution table of 'Age Group' 7. 7. Make cross - table between Q1 and Age Group showing the data in percentage, and write your comment.
Step by Step Solution
There are 3 Steps involved in it
Step: 1

Get Instant Access to Expert-Tailored Solutions
See step-by-step solutions with expert insights and AI powered tools for academic success
Step: 2

Step: 3
Ace Your Homework with AI
Get the answers you need in no time with our AI-driven, step-by-step assistance
Get Started
Probability and Stochastic Processes A Friendly Introduction for Electrical and Computer Engineers
Authors: Roy D. Yates, David J. Goodman
3rd edition
1118324560, 978-1118324561