

Answered step by step
Verified Expert Solution
Question
1 Approved Answer
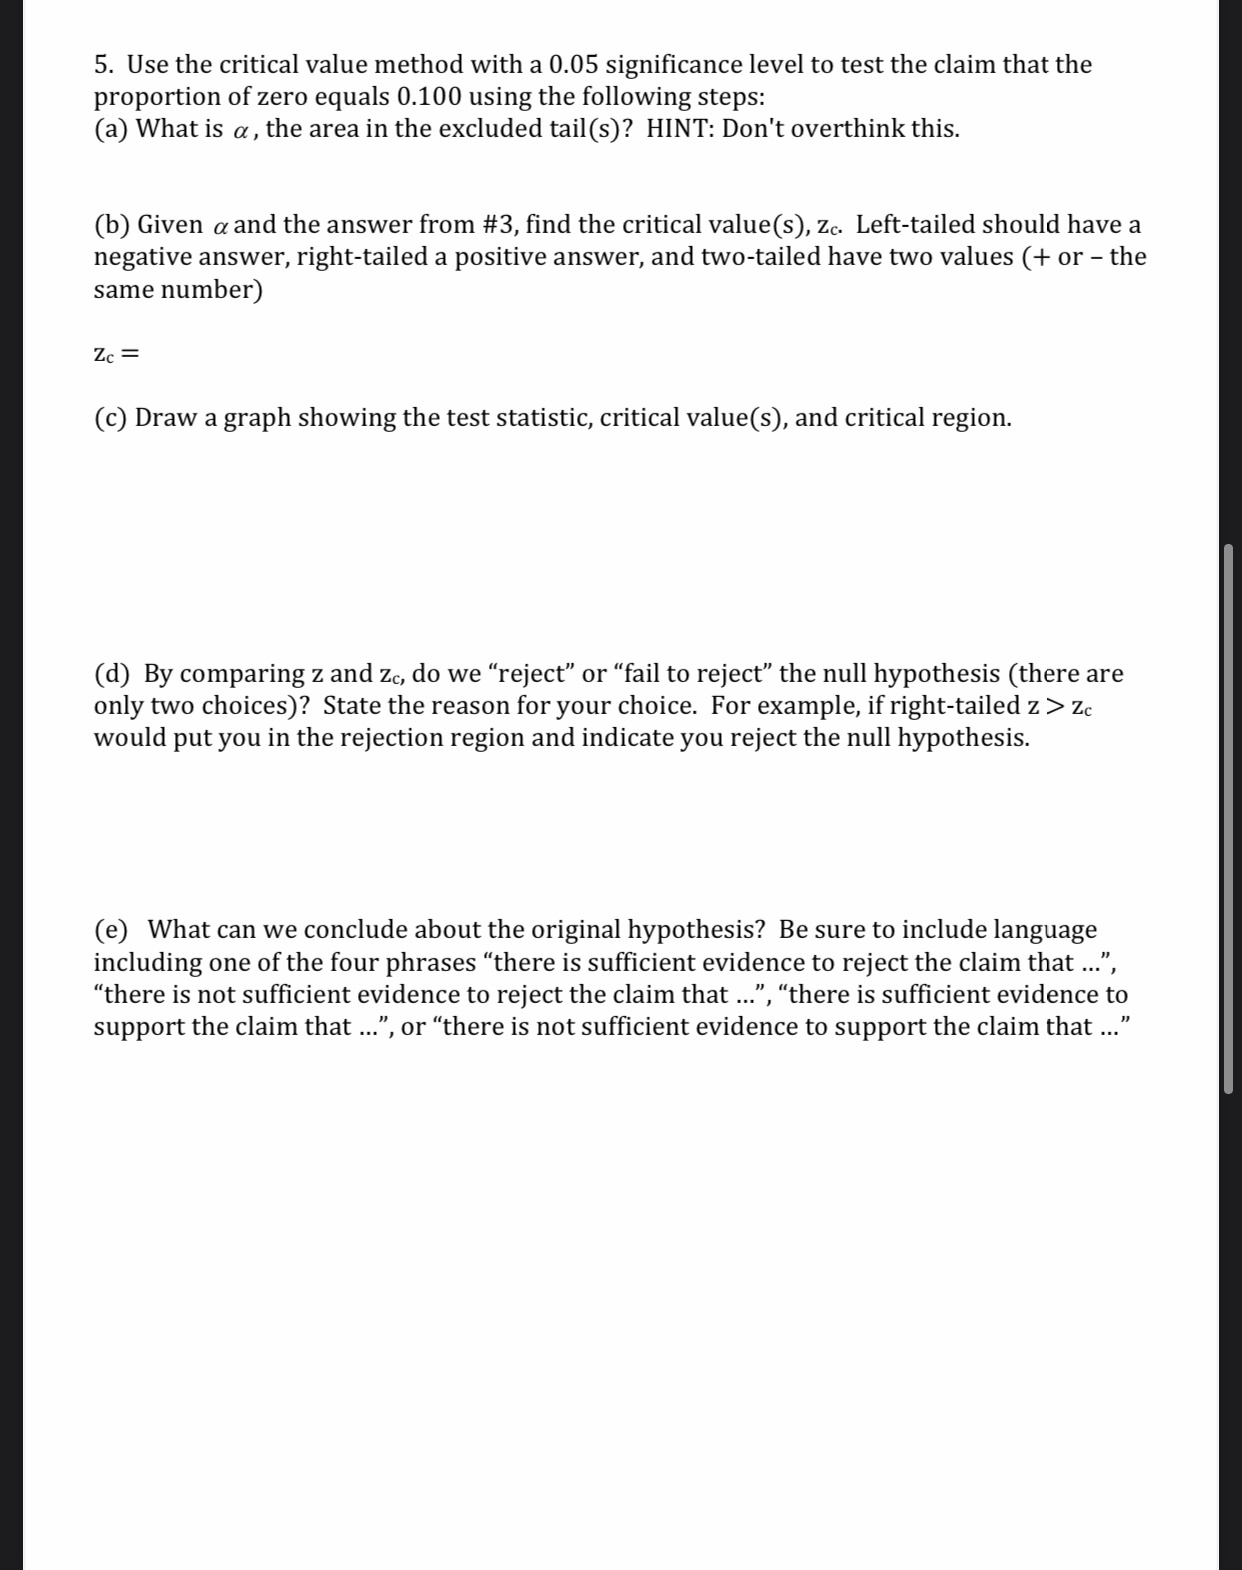
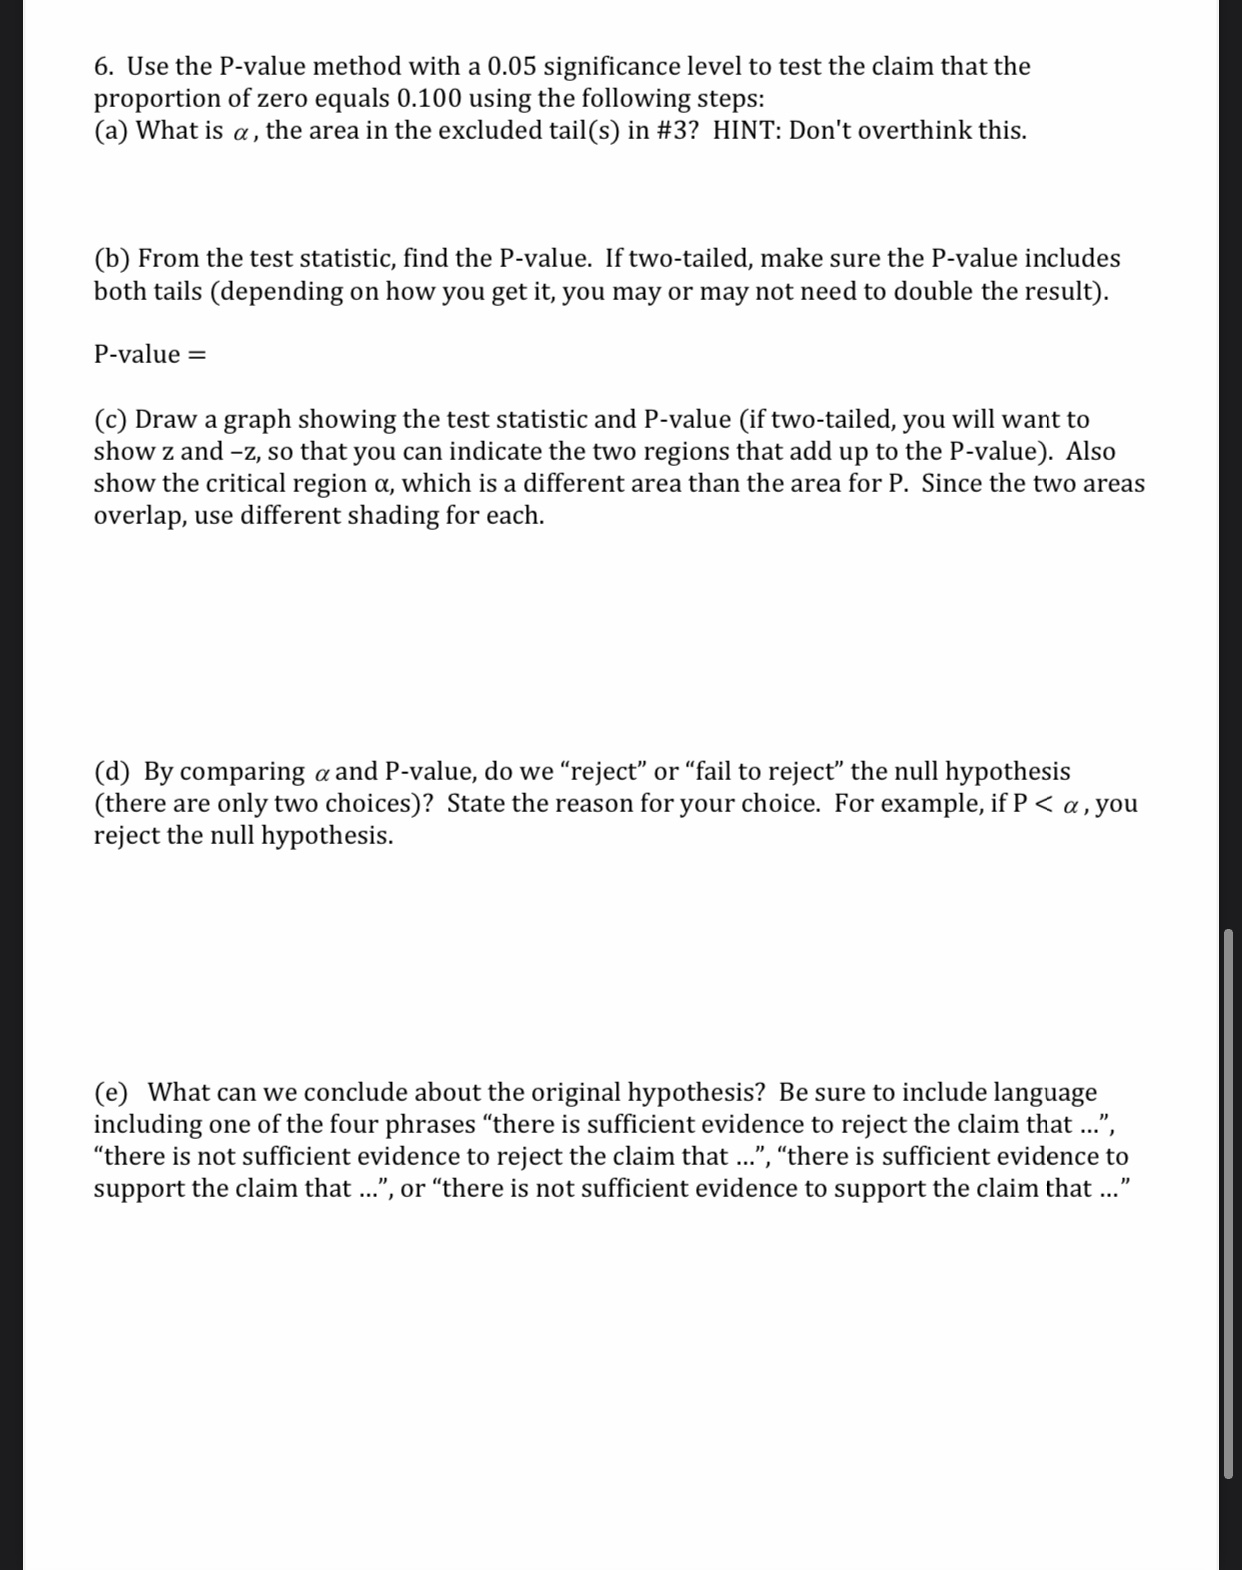
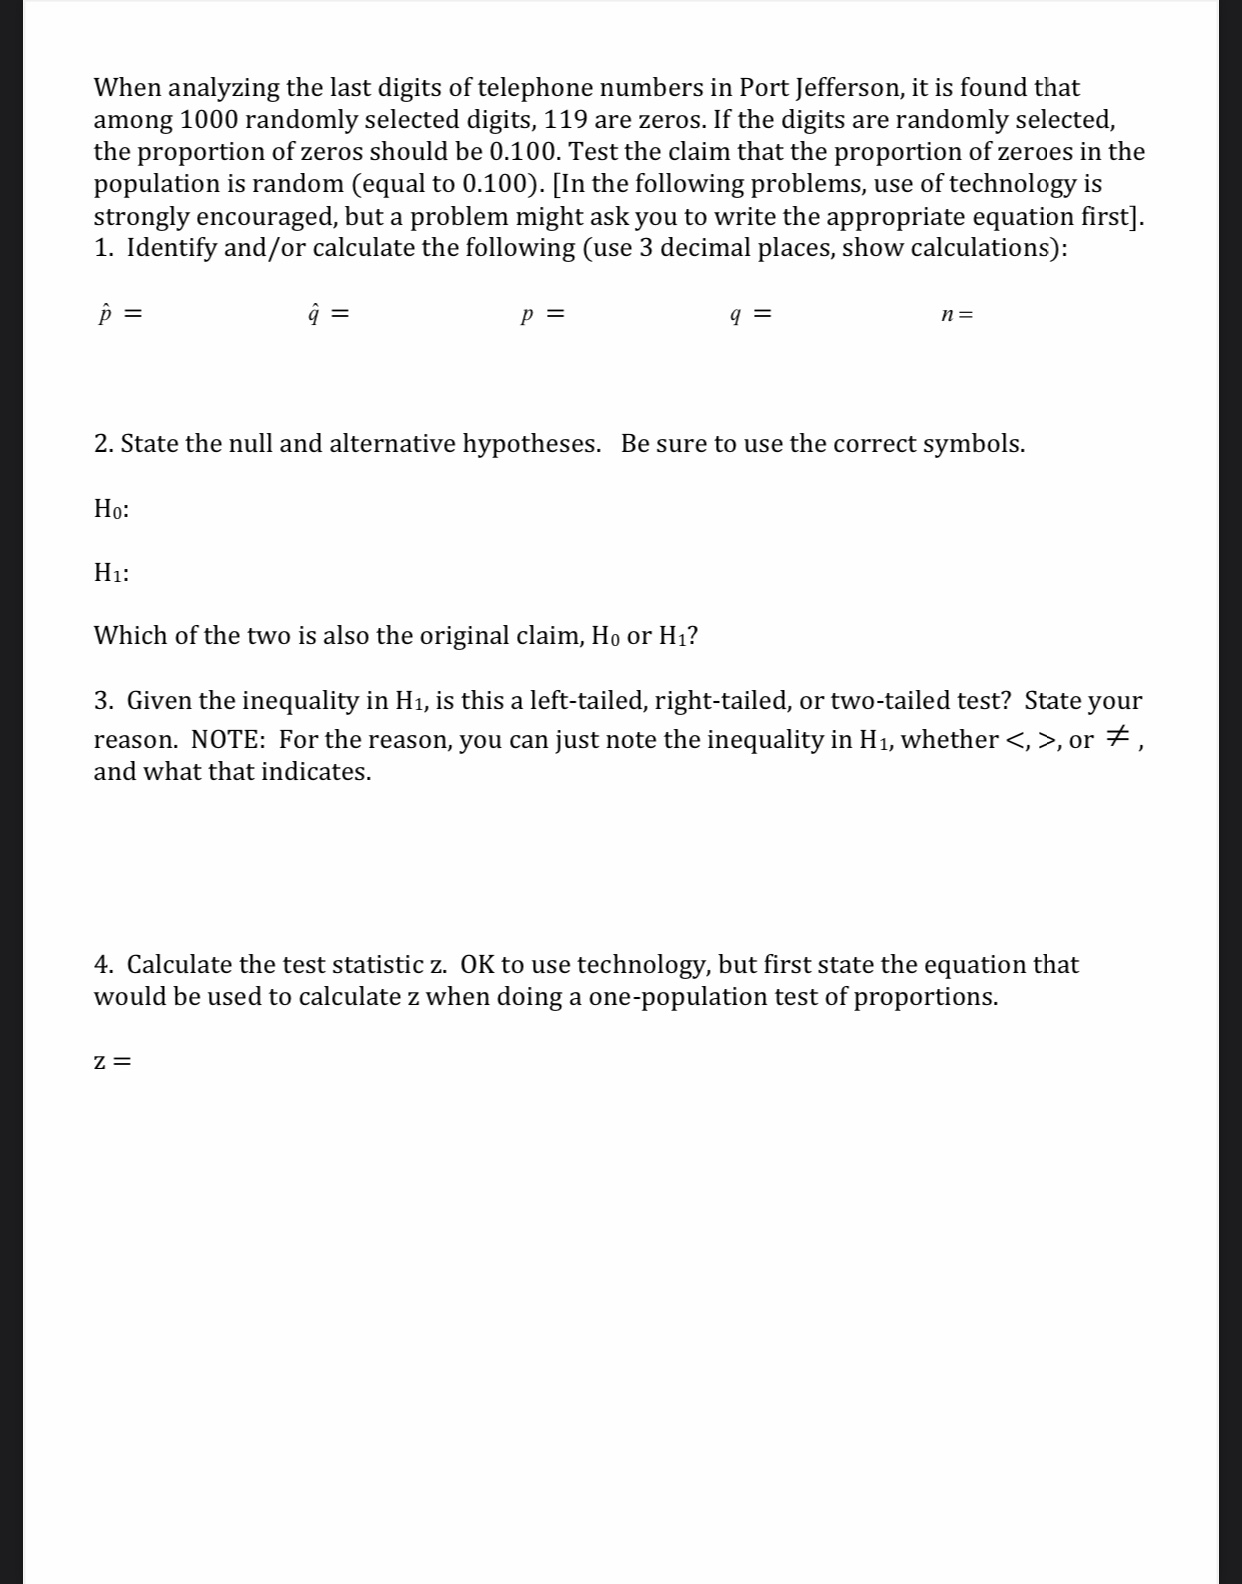
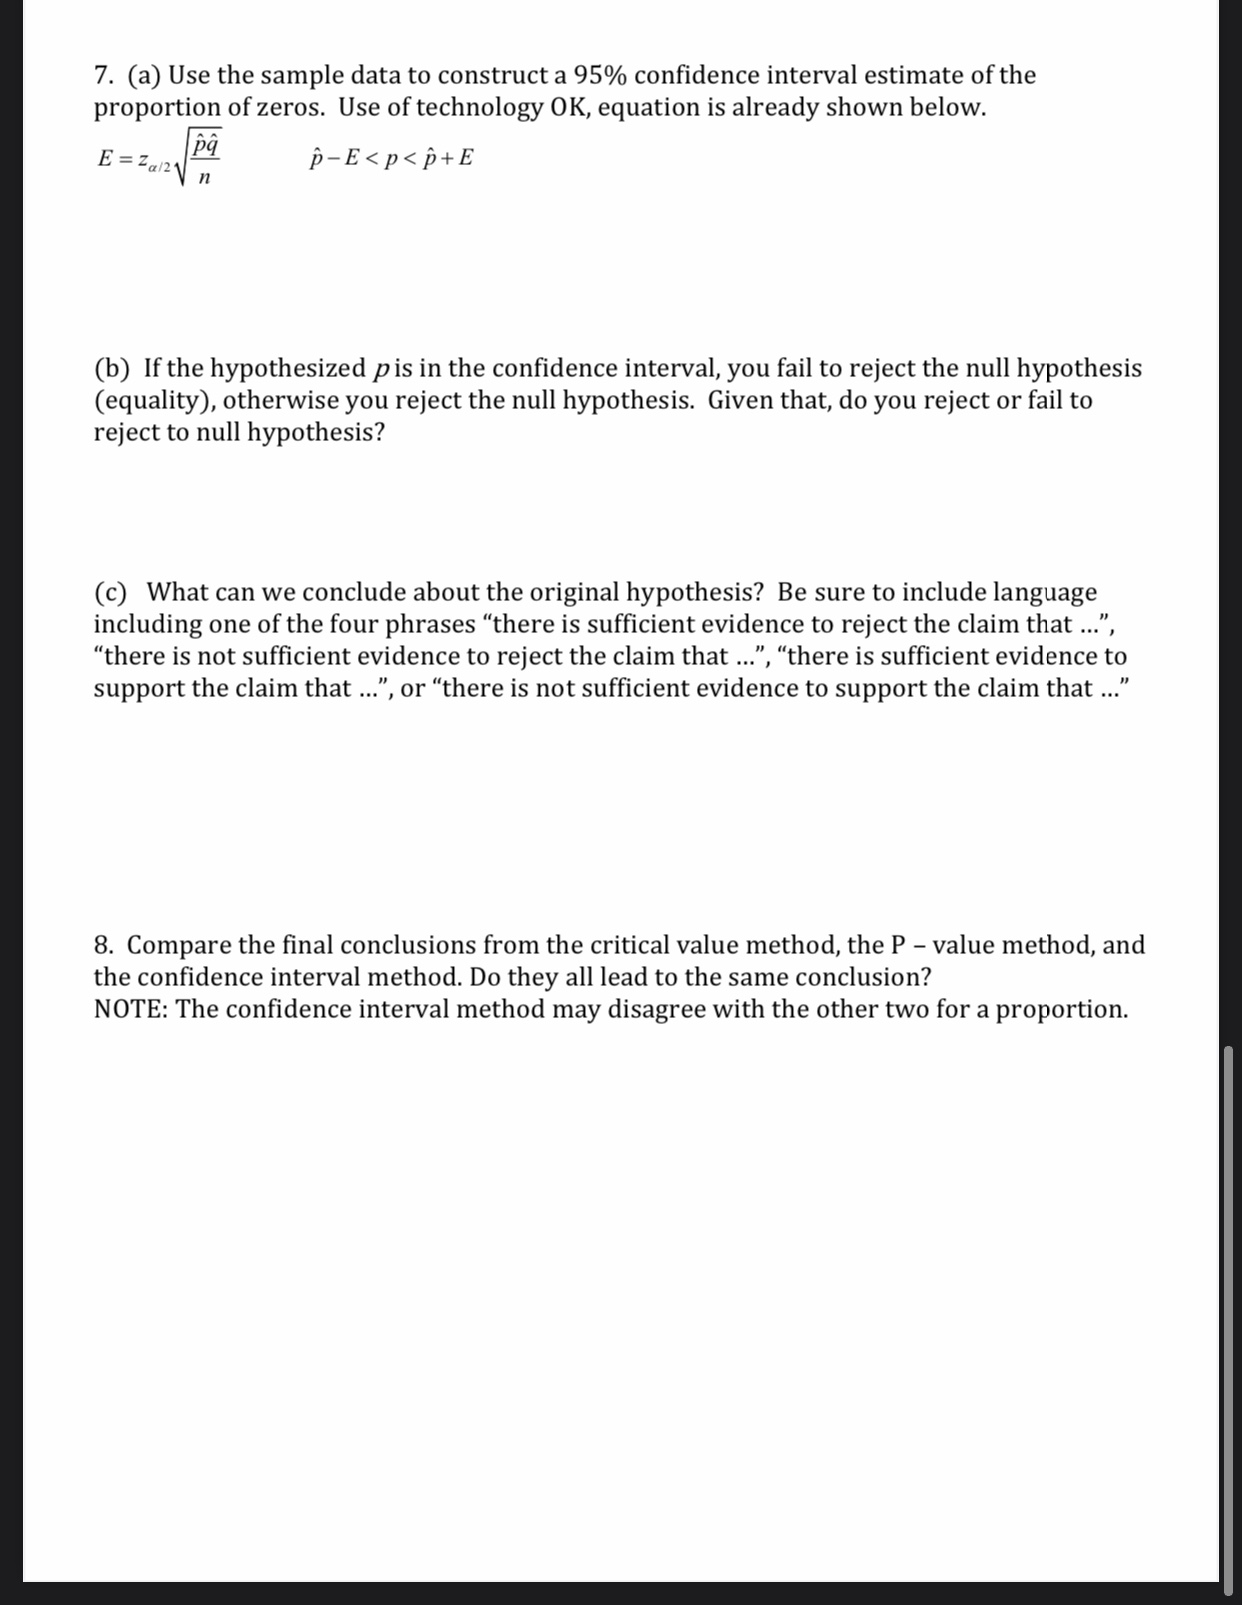
5. Use the critical value method with a 0.05 signicance level to test the claim that the proportion of zero equals 0.100 using the following
Step by Step Solution
There are 3 Steps involved in it
Step: 1

Get Instant Access to Expert-Tailored Solutions
See step-by-step solutions with expert insights and AI powered tools for academic success
Step: 2

Step: 3
Ace Your Homework with AI
Get the answers you need in no time with our AI-driven, step-by-step assistance
Get Started
Intermediate Algebra With Trigonometry
Authors: Charles P McKeague
1st Edition
1483218759, 9781483218755