

Question
5. Use the data in the following table to a. prepare a frequency distribution of the respondents ages; b. cross-tabulate the respondents genders with cola
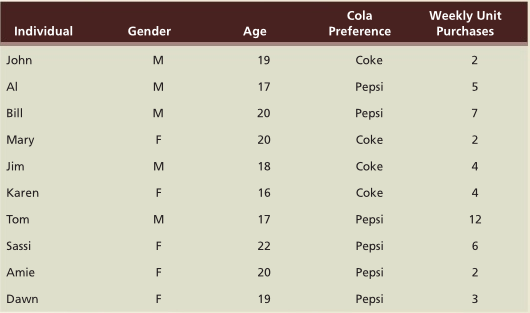
5. Use the data in the following table to
a. prepare a frequency distribution of the respondents ages;
b. cross-tabulate the respondents genders with cola preference; and
c. identify any outlier
7. The following computer output shows a cross-tabulation of frequencies and provides frequency number (N) and row (R) percentages.
a. Interpret this output including an impression about whether or not the row and column variables are related.
b. Critique the way the analysis is presented.
Individual John Mary Jim Karen Tom Sassi Amie Dawn Gender Age 19 20 20 18 16 22 20 19 Cola Preference Coke Pepsi Pepsi Coke Coke Coke Pepsi Pepsi Pepsi Pepsi Weekly Unit Purchases 12Step by Step Solution
There are 3 Steps involved in it
Step: 1

Get Instant Access to Expert-Tailored Solutions
See step-by-step solutions with expert insights and AI powered tools for academic success
Step: 2

Step: 3
Ace Your Homework with AI
Get the answers you need in no time with our AI-driven, step-by-step assistance
Get Started
Financial Accounting Self Study Problems/Solutions Book
Authors: Jerry J. Weygandt, Donald E. Kieso, Paul D. Kimmel
4th Edition
0471205133, 978-0471205135