Question
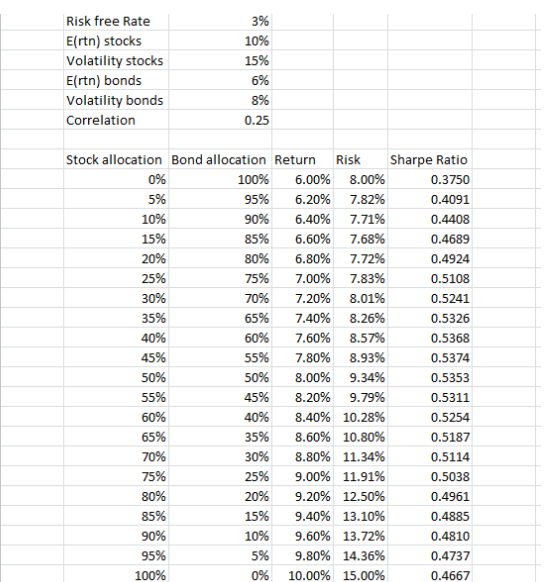
5) Using the table created in Problem #2 above, plot the opportunity set of risky assets in Excel. Then vary the correlation between stocks and

5) Using the table created in Problem #2 above, plot the opportunity set of risky assets in Excel.
Then vary the correlation between stocks and bonds from + 1 to -1 and describe the changes in shape of the efficient frontier as you do so.
Upload the Excel file that contains the table & graph.
Also include in Excel file a description of the efficient frontier's shape as you vary the correlation. (10 pts)
6) Using the graph of the opportunity set of risky assets created in Problem #5, answer the following:
a) Change the correlation of stocks and bonds back to 0.25 and observe the shape of the efficient frontier.
Starting at the point that corresponds to 100% Bonds & 0% Stocks, describe what happens to portfolio risk and return as you increase the stock allocation and decrease the bond allocation? Why is this happening? (10 pts)
Risk free Rate Ertn) stocks Volatility stocks Ertn) bonds Volatility bonds Correlation 3% 10% 15% 6% 8% 0.25 Stock allocation Bond allocation Return Risk Sharpe Ratio 0% 100% 6.00% 8.00% 0.3750 5% 95% 6.20% 7.82% 0.4091 10% 90% 6.40% 7.71% 0.4408 15% 85% 6.60% 7.68% 0.4689 20% 80% 6.80% 7.72% 0.4924 25% 75% 7.00% 7.83% 0.5108 30% 70% 7.20% 8.01% 0.5241 35% 65% 7.40% 8.26% 0.5326 40% 60% 7.60% 8.57% 0.5368 45% 55% 7.80% 8.93% 0.5374 50% 50% 8.00% 9.34% 0.5353 55% 45% 8.20% 9.79% 0.5311 60% 40% 8.40% 10.28% 0.5254 65% 35% 8.60% 10.80% 0.5187 70% 30% 8.80% 11.34% 0.5114 75% 25% 9.00% 11.91% 0.5038 80% 20% 9.20% 12.50% 0.4961 85% 15% 9.40% 13.10% 0.4885 90% 10% 9.60% 13.72% 0.4810 95% 5% 9.80% 14.36% 0.4737 100% 0% 10.00% 15.00% 0.4667 Risk free Rate Ertn) stocks Volatility stocks Ertn) bonds Volatility bonds Correlation 3% 10% 15% 6% 8% 0.25 Stock allocation Bond allocation Return Risk Sharpe Ratio 0% 100% 6.00% 8.00% 0.3750 5% 95% 6.20% 7.82% 0.4091 10% 90% 6.40% 7.71% 0.4408 15% 85% 6.60% 7.68% 0.4689 20% 80% 6.80% 7.72% 0.4924 25% 75% 7.00% 7.83% 0.5108 30% 70% 7.20% 8.01% 0.5241 35% 65% 7.40% 8.26% 0.5326 40% 60% 7.60% 8.57% 0.5368 45% 55% 7.80% 8.93% 0.5374 50% 50% 8.00% 9.34% 0.5353 55% 45% 8.20% 9.79% 0.5311 60% 40% 8.40% 10.28% 0.5254 65% 35% 8.60% 10.80% 0.5187 70% 30% 8.80% 11.34% 0.5114 75% 25% 9.00% 11.91% 0.5038 80% 20% 9.20% 12.50% 0.4961 85% 15% 9.40% 13.10% 0.4885 90% 10% 9.60% 13.72% 0.4810 95% 5% 9.80% 14.36% 0.4737 100% 0% 10.00% 15.00% 0.4667Step by Step Solution
There are 3 Steps involved in it
Step: 1

Get Instant Access to Expert-Tailored Solutions
See step-by-step solutions with expert insights and AI powered tools for academic success
Step: 2

Step: 3

Ace Your Homework with AI
Get the answers you need in no time with our AI-driven, step-by-step assistance
Get Started


