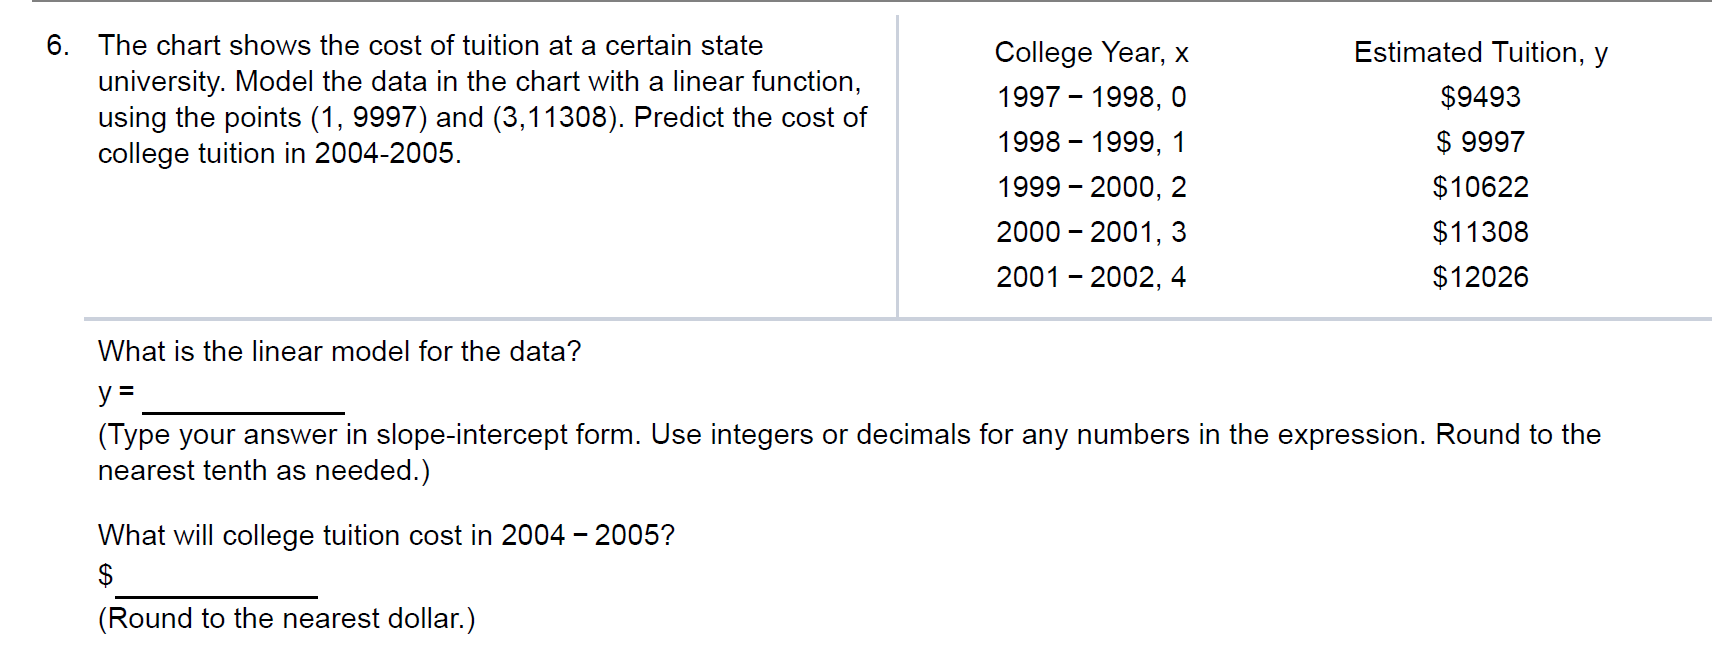
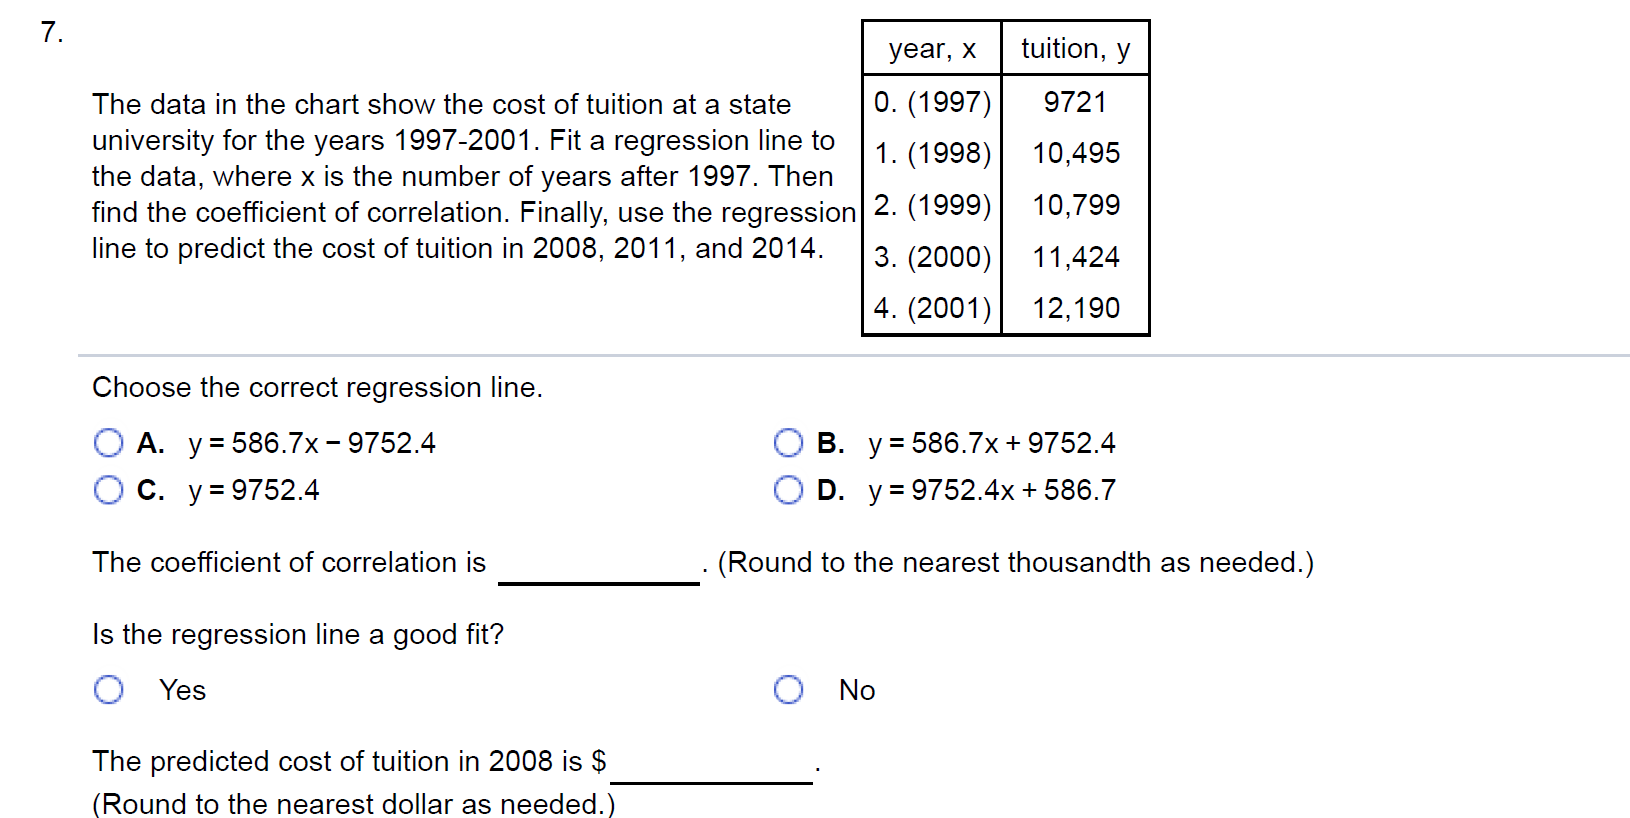
5. Write a slopeintercept equation for a line passing through the given point that is parallel to the given line. Then write a second equation for a line passing through the given point that is perpendicular to the given line. (5, 0), y= o.9x+4.7 Choose the correct equations. 0 A. _ 1o 50 parallel: y = - 0.9x + 4.5 perpendicular: y = ?x - ? O B. _ 1o 50 parallel: y = - 0.9x - 4.5 perpendicular: y = ?x + ? O c. 10 50 parallel: y = 0.9x - 4.5 perpendicular: y = - x - 9 9 6. The chart shows the cost of tuition at a certain state College Year, x university. Model the data in the chart with a linear function, using the points (1, 9997) and (311308). Predict the cost of 1997 _1998' 0 college tuition in 20042005. 1998 ' 1999- 1 1999 2000, 2 2000 - 2001, 3 2001 2002, 4 What is the linear model for the data? y = Estimated Tuition, y $9493 $ 9997 $10622 $1 1308 $12026 (Type your answer in slope-intercept form. Use integers or decimals for any numbers in the expression. Round to the nearest tenth as needed.) What will college tuition cost in 2004 - 2005? $ (Round to the nearest dollar.) The data in the chart show the cost of tuition at a state 0. (1997 university for the years 19972001. Fit a regression line to 1_ (1998 the data, where x is the number of years after 1997. Then find the coefficient of correlation. Finally, use the regression 2- (1999 line to predict the cost of tuition in 2008, 2011, and 2014. 3_ (2000 ) ) ) ) ) 4. (2001 Choose the correct regression line. C) A. y = 586.7x - 9752.4 0 B. y = 586.7x + 9752.4 0 C. y = 9752.4 0 D. y = 9752.4x + 586.7 The coefficient of correlation is . (Round to the nearest thousandth as needed.) Is the regression line a good fit? 0 Yes O No The predicted cost of tuition in 2008 is $ (Round to the nearest dollar as needed.)