Question
5. You are asked to evaluate the performance of two classification models, M1 and M2. The test set contains 26 attributes labelled A through

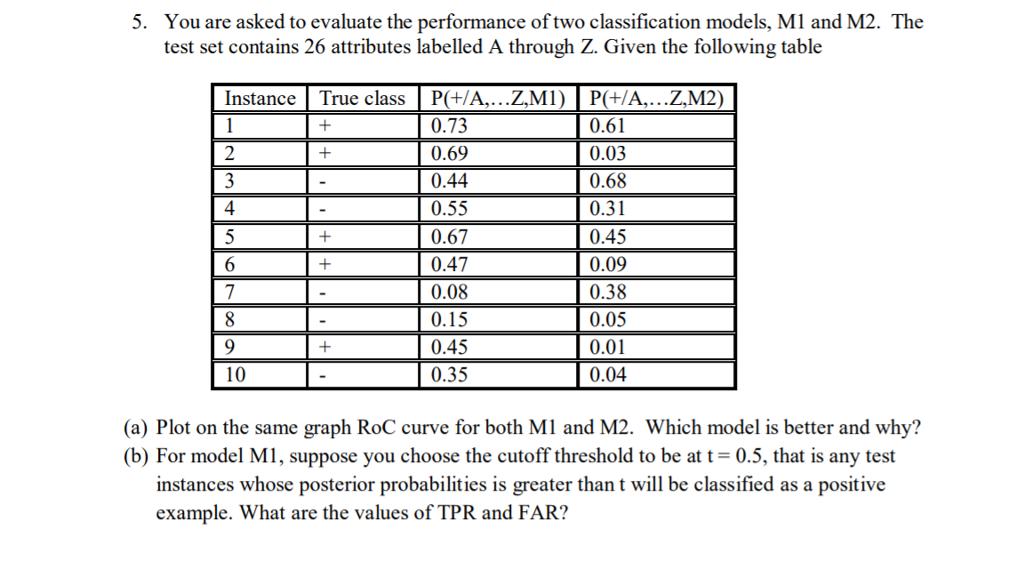
5. You are asked to evaluate the performance of two classification models, M1 and M2. The test set contains 26 attributes labelled A through Z. Given the following table Instance 1 True class P(+/A,...Z,M1) P(+/A,...Z,M2) + 0.73 0.61 2 + 0.69 0.03 3 - 0.44 0.68 4 - 0.55 0.31 5 + 0.67 0.45 6 + 0.47 0.09 7 - 0.08 0.38 8 - 0.15 0.05 9 + 0.45 0.01 10 0.35 0.04 (a) Plot on the same graph RoC curve for both M1 and M2. Which model is better and why? (b) For model M1, suppose you choose the cutoff threshold to be at t=0.5, that is any test instances whose posterior probabilities is greater than t will be classified as a positive example. What are the values of TPR and FAR?
Step by Step Solution
There are 3 Steps involved in it
Step: 1

Get Instant Access to Expert-Tailored Solutions
See step-by-step solutions with expert insights and AI powered tools for academic success
Step: 2

Step: 3

Ace Your Homework with AI
Get the answers you need in no time with our AI-driven, step-by-step assistance
Get StartedRecommended Textbook for
Introduction to Data Mining
Authors: Pang Ning Tan, Michael Steinbach, Vipin Kumar
1st edition
321321367, 978-0321321367
Students also viewed these Programming questions
Question
Answered: 1 week ago
Question
Answered: 1 week ago
Question
Answered: 1 week ago
Question
Answered: 1 week ago
Question
Answered: 1 week ago
Question
Answered: 1 week ago
Question
Answered: 1 week ago
Question
Answered: 1 week ago
Question
Answered: 1 week ago
Question
Answered: 1 week ago
Question
Answered: 1 week ago
Question
Answered: 1 week ago
Question
Answered: 1 week ago
Question
Answered: 1 week ago
Question
Answered: 1 week ago
Question
Answered: 1 week ago
Question
Answered: 1 week ago
Question
Answered: 1 week ago
Question
Answered: 1 week ago
Question
Answered: 1 week ago
Question
Answered: 1 week ago
Question
Answered: 1 week ago
View Answer in SolutionInn App


