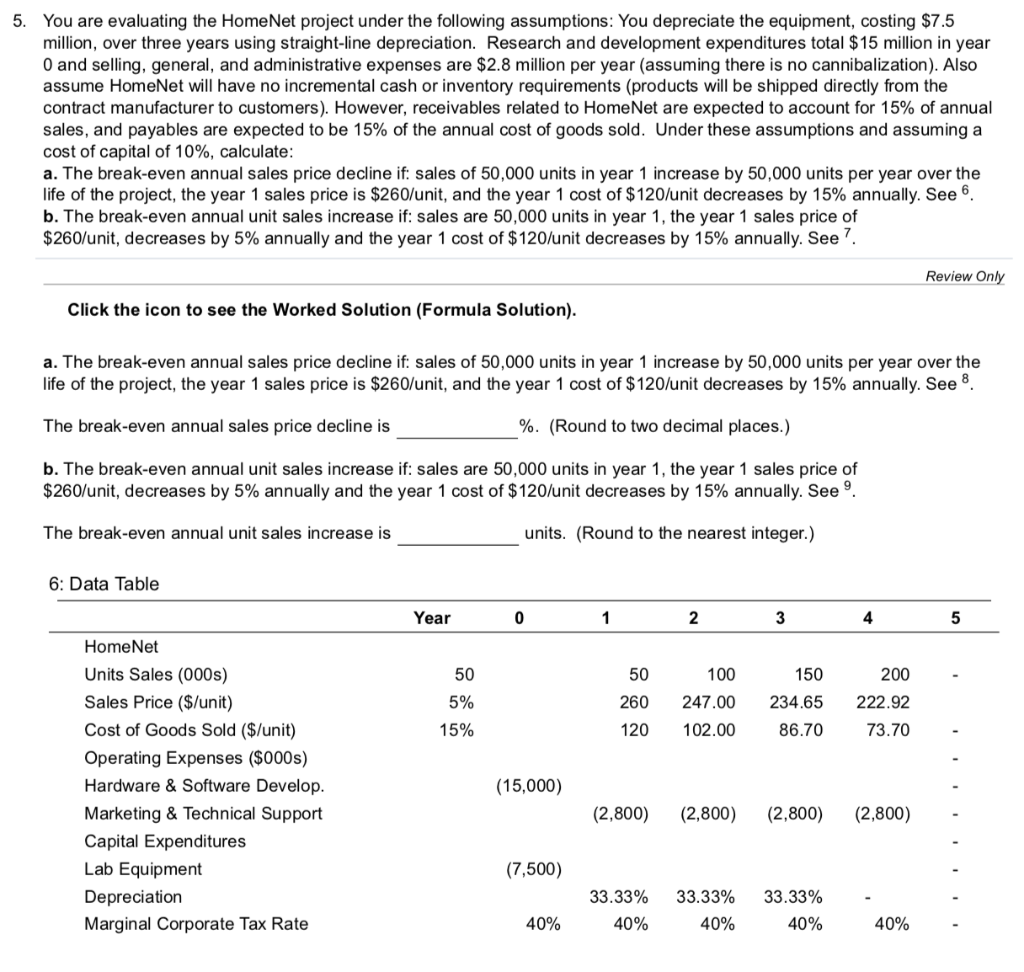
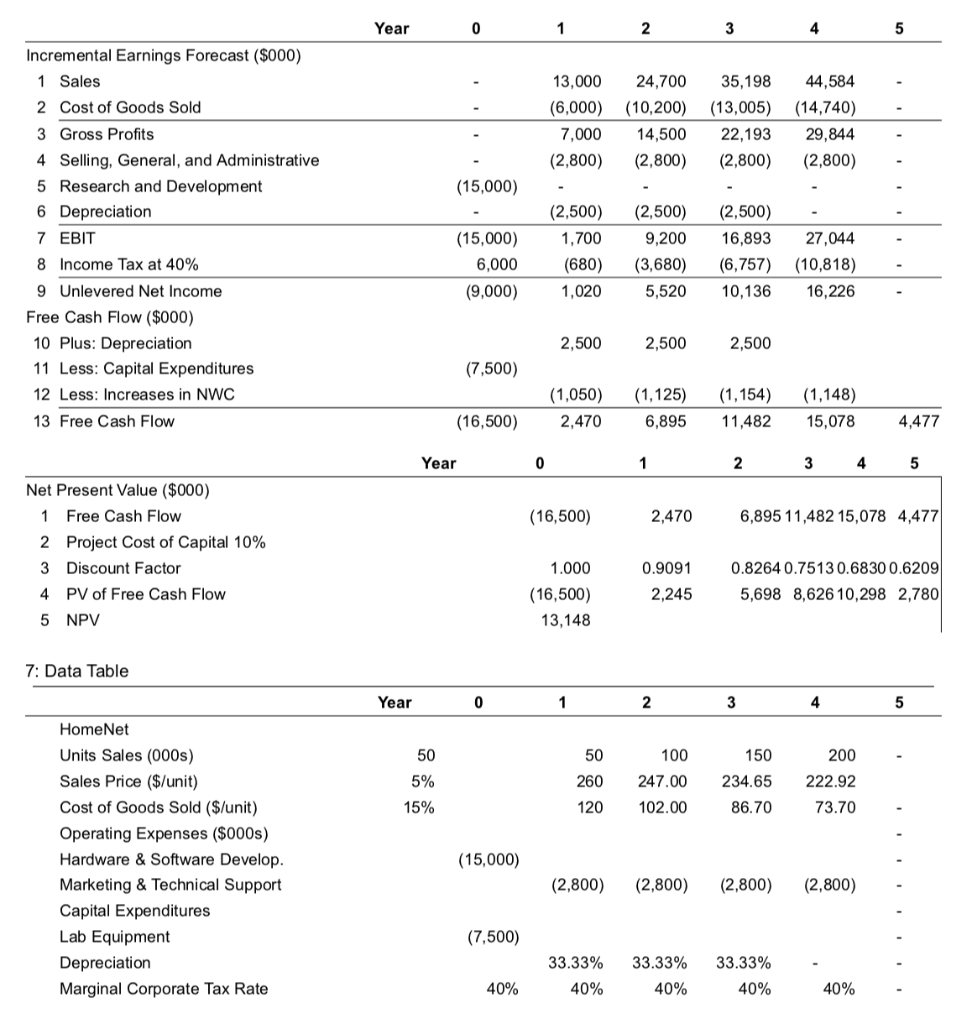
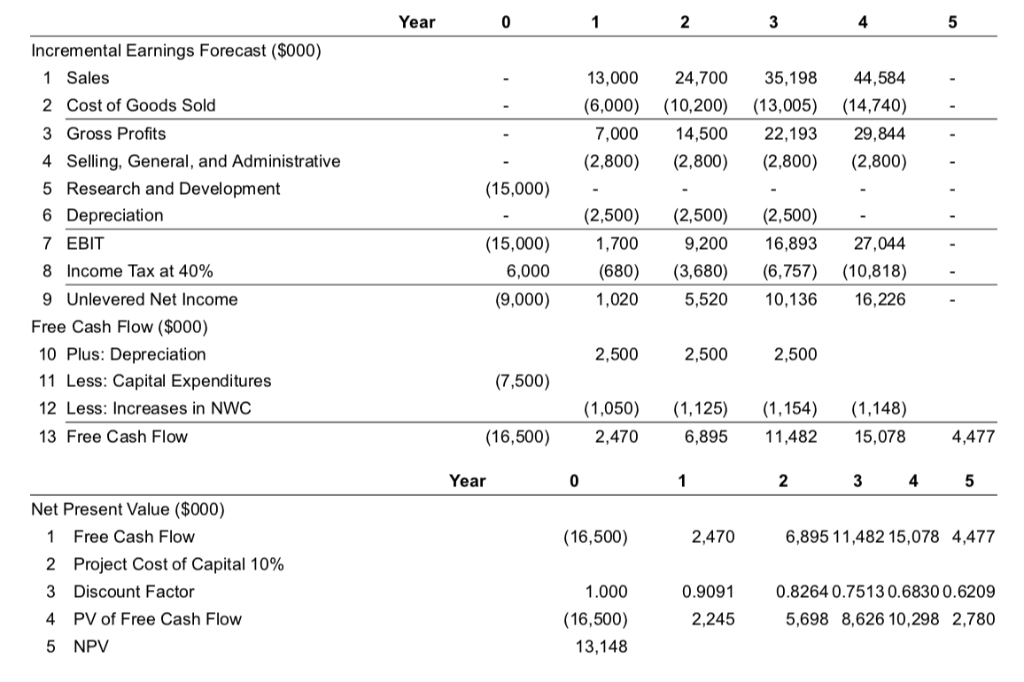
5. You are evaluating the HomeNet project under the following assumptions: You depreciate the equipment, costing $7.5 million, over three years using straight-line depreciation. Research and development expenditures total $15 million in year 0 and selling, general, and administrative expenses are $2.8 million per year (assuming there is no cannibalization). Also assume HomeNet will have no incremental cash or inventory requirements (products will be shipped directly from the contract manufacturer to customers). However, receivables related to HomeNet are expected to account for 15% of annual sales, and payables are expected to be 15% of the annual cost of goods sold. Under these assumptions and assuming a cost of capital of 10%, calculate a. The break-even annual sales price decline if: sales of 50,000 units in year 1 increase by 50,000 units per year over the life of the project, the year 1 sales price is $260/unit, and the year 1 cost of $120/unit decreases by 15% annually. See 6. b. The break-even annual unit sales increase if: sales are 50,000 units in year 1, the year 1 sales price of $260/unit, decreases by 5% annually and the year 1 cost of $120/unit decreases by 15% annually. See 7 Review On Click the icon to see the Worked Solution (Formula Solution) a. The break-even annual sales price decline if: sales of 50,000 units in year 1 increase by 50,000 units per year over the life of the project, the year 1 sales price is $260/unit, and the year 1 cost of $120/unit decreases by 15% annually. See 8 The break-even annual sales price decline is b. The break-even annual unit sales increase if: sales are 50,000 units in year 1, the year 1 sales price of %. (Round to two decimal places.) $260/unit, decreases by 5% annually and the year 1 cost of $120/unit decreases by 15% annually. See 9 The break-even annual unit sales increase is units. (Round to the nearest integer.) 6: Data Table Year 1 2 3 4 5 HomeNet Units Sales (000s) Sales Price ($/unit) Cost of Goods Sold ($/unit) Operating Expenses ($000s) Hardware & Software Develop Marketing & Technical Support Capital Expenditures Lab Equipment Depreciation Marginal Corporate Tax Rate 50 5% 15% 200 260 247.00 234.65 222.92 73.70 50 100 150 120 102.00 86.70 (15,000) (2,800)2,800) (2,800) (2,800) (7,500) 33.33% 33.33% 40% 33.33% 40% 40% Year 1 4 5 Incremental Earnings Forecast ($000) 1 Sales 2 Cost of Goods Sold 3 Gross Profits 4 Selling, General, and Administrative 5 Research and Development 6 Depreciation 7 EBIT 8 Income Tax at 40% 9 Unlevered Net Income 13,000 24,700 35,19844,584 (6,000) (10,200) (13,005) (14,740) 7,000 14,500 22,193 29,844 (2,800)2,800) 2,800) (2,800) (15,000) (2,500) 2,500 (2,500) (15,000) 1,700 9,200 16,89327,044 6,000 680 (3,680 6,757) 10,818) (9,000),020 5,520 10,136 16,226 Free Cash Flow ($000) 2,500 2,500 10 Plus: Depreciation 11 Less: Capital Expenditures 12 Less: Increases in NWC 13 Free Cash Flow 2,500 (7,500) 1,050 ,154) 1,148) 16,500) 2,470 6,89511,482 15,078 4,477 Year 4 Net Present Value ($000) Free Cash Flow Project Cost of Capital 10% Discount Factor PV of Free Cash Flow NPV 1 (16,500) 2,470 6,895 11,482 15,078 4,477 2 3 4 5 1.000 (16,500) 13,148 0.9091 2,245 0.8264 0.75130.6830 0.6209 5,698 8,62610,298 2,780 7: Data Table Year 5 HomeNet Units Sales (000s) Sales Price ($/unit) Cost of Goods Sold (S/unit) Operating Expenses ($000s) Hardware & Software Develop Marketing &Technical Support Capital Expenditures Lab Equipment Depreciation Marginal Corporate Tax Rate 50 5% 15% 200 260 247.00 234.65 222.92 73.70 50 100 150 120 102.00 86.70 (15,000) (2,800) 2,800 (2,800) (2,800) (7,500) 33.33% 40% 33.33% 40% 33.33% 40% 40% Year 4 Incremental Earnings Forecast ($000) 1 Sales 2 Cost of Goods Sold 3 Gross Profits 4 Selling, General, and Administrative 5 Research and Development 6 Depreciation 7 EBIT 8 Income Tax at 40% 9 Unlevered Net Income 13,000 24,700 35,198 44,584 (6,000) (10,200 (13,005) (14,740) 7,00014,500 22,193 29,844 (2,800) 2,800) (2,800) (2,800) (15,000) (2,500) (2,500 (2,500) 15,000) 1,700 9,200 6,893 27,044 6,000 680 (3,680 (6,757) 10,818) (9,000)1,020 5,520 10,136 16,226 Free Cash Flow ($000) 2,500 2,500 2,500 10 Plus: Depreciation 11 Less: Capital Expenditures 2 Less: Increases in NWC 13 Free Cash Flow (7,500) (1,050) ,125 1,154) 1,148) (16,500 2,470 6,895 11,482 5,078 4,477 Year 2 4 5 Net Present Value ($000) (16,500) 2,470 Free Cash Flow 2 Project Cost of Capital 10% 3 Discount Factor 4 PV of Free Cash Flow 5 NPV 6,89511,482 15,078 4,477 1.000 (16,500) 13,148 0. 90910.8264 0.7513 0.68300.6209 2,245 5,698 8,626 10,298 2,780