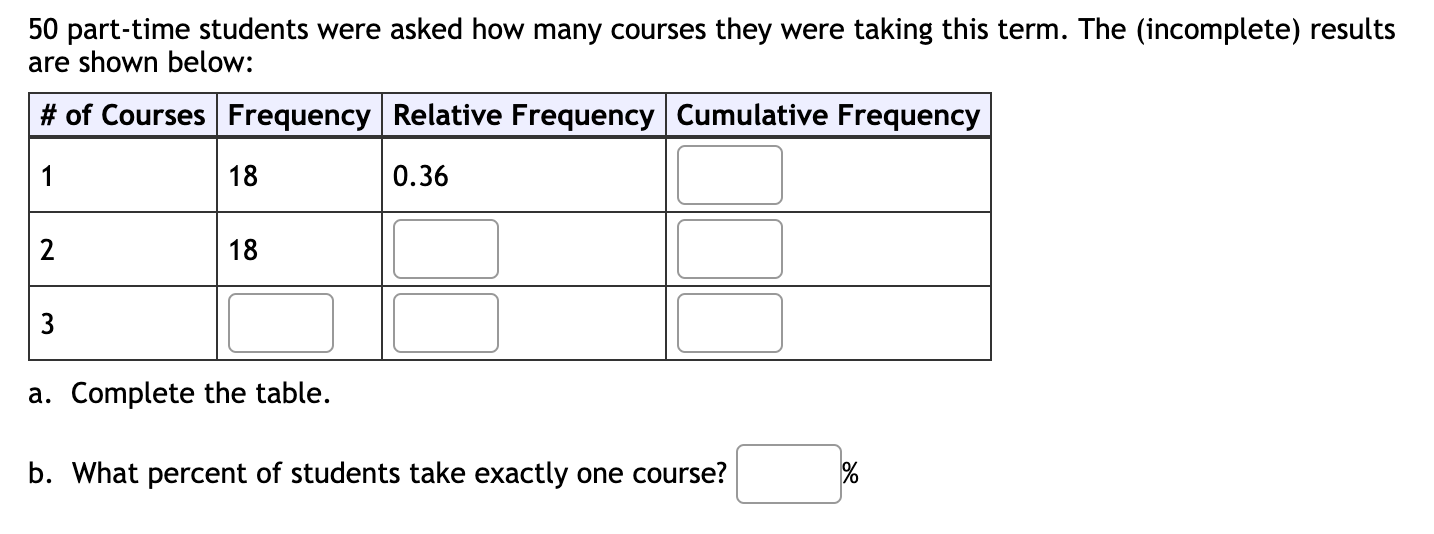
50 part-time students were asked how many courses they were taking this term. The (incomplete) results are shown below: # of Courses Frequency | Relative
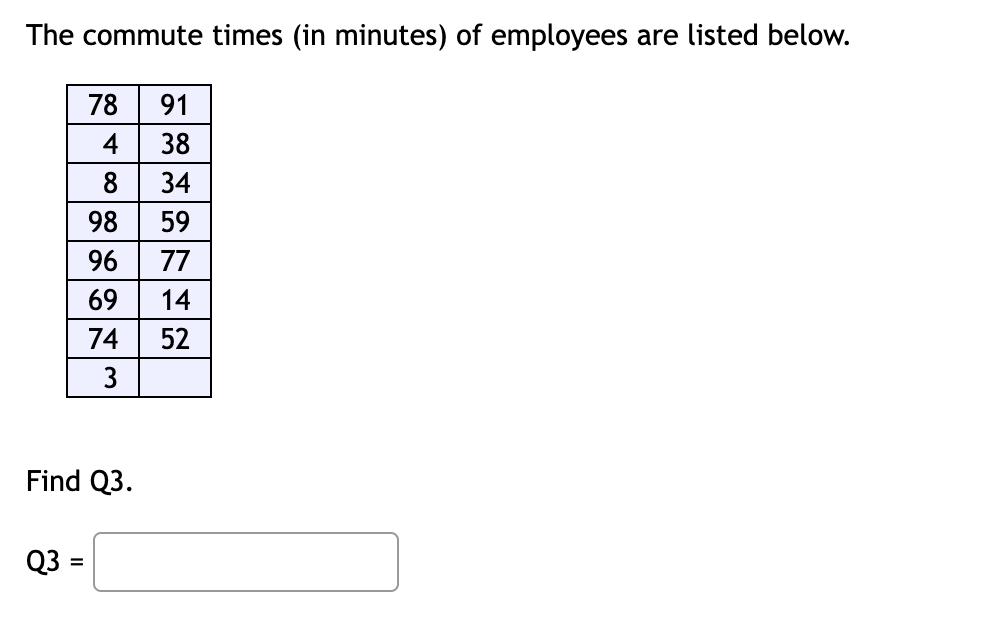
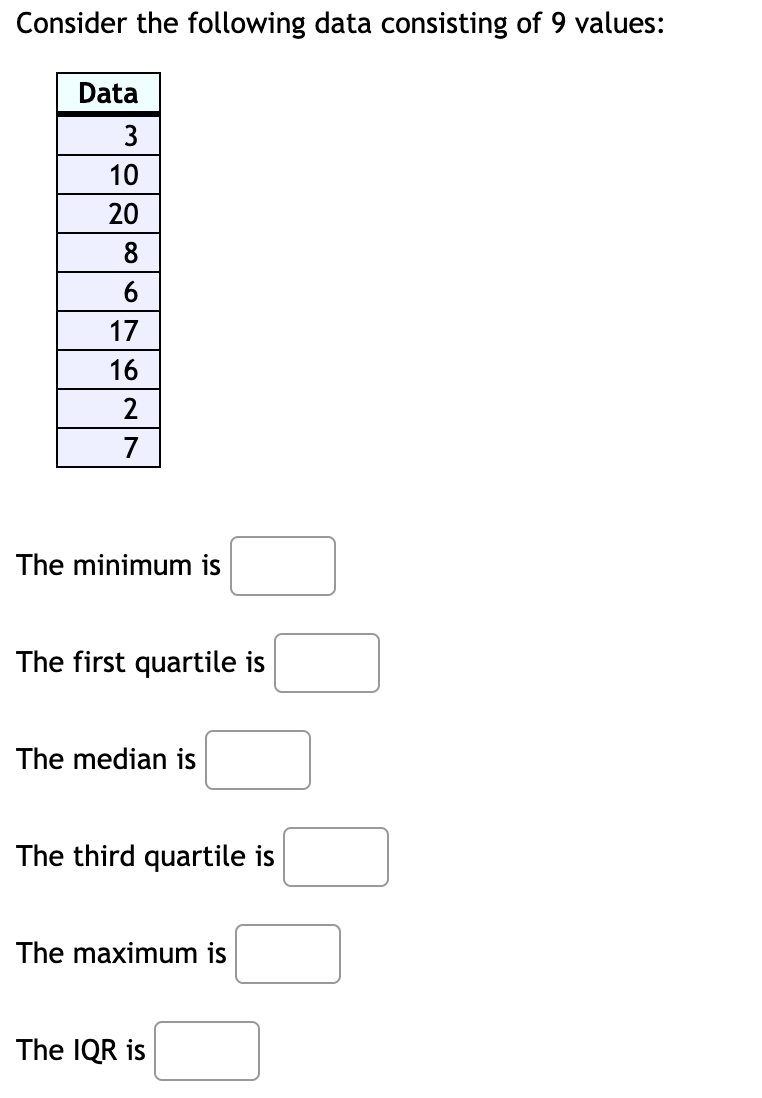
50 part-time students were asked how many courses they were taking this term. The (incomplete) results are shown below: # of Courses Frequency | Relative Frequency |Cumulative Frequency 18 0.36 2 18 3 a. Complete the table. b. What percent of students take exactly one course? %\fConsider the following data consisting of 9 values: Data 3 10 20 8 6 17 16 2 7 The minimum is The first quartile is The median is The third quartile is The maximum is The IQR is69 randomly selected students were asked the number of pairs of shoes they have. Let X represent the number of pairs of shoes. The results are as follows: \"lllll nnnnn-n-- Round all your answers to 4 decimal places where possible. The mean is: [:] The median is: C] The sample standard deviation is: [:] The first quartile is: I: What percent of the respondents have at least 7 pairs of Shoes? [:96 The third quartile is: 56% of all respondents have fewer than how many pairs of Shoes? C] Suppose that 15% of people own dogs. If you pick two people at random, what is the probability that they both own a dog? Give your answer as a decimal (to at least 3 places) or fraction Assume that a procedure yields a binomial distribution with a trial repeated 11. = 5 times. Use some form of technology to find the probability distribution given the probability p = 0.145 of success on a single trial. (Report answers accurate to 4 decimal places.) A consumer group claims that the average annual consumption of high fructose corn syrup by a person in the U.S. is 48.8 pounds. You believe it is higher. You take a simple random sample of 35 people in the U.S. and find an average of 53.5 pounds with a standard deviation of 5.6 pounds. Test at 10% significance. Round to the fourth as needed We can work this oroblem because: Select an answer v H0: Select an answer v Select an answer v C] H A: Select an answer v Select an answer V l:] Test Statistic: C] P-value: C] Did something significant happen? Select the Decision Rule: There enough evidence to conclude The work week for adults in the US that work full time is normally distributed with a mean of 47 hours. A newly hired engineer at a start-up company believes that employees at start-up companies work more on average then most working adults in the US. She asks 12 engineering friends at start-ups for the lengths in hours of their work week. Their responses are shown in the table below. Test the claim using a 5% level of significance. Give answer to at least 4 decimal places. What are the correct hypotheses? Ho: Select an answer v C] hours H1: Select an answer v C] hours Based on the hypotheses, find the following: Test Statistic=[:] Test Statistic=:] The correct decision is to Select an answer v . The correct summary would be: Select an answer v that the mean number of hours of all employees at start-up companies work more than the US mean of 47 hours. The manufacturer of a particular brand of tires claims they average at least 50,000 miles before needing to be replaced. From past studies of this tire, it is known that the population standard deviation is 8,000 miles. A survey of tire owners was conducted. From the 24 tires surveyed, the mean lifespan was 45500 miles. Using alpha = 0.05, can we prove that the data is inconsistent with the manufacturers claim? We should use a test. What are the correct hypotheses? Ho: Select an answer v C] Ha: Select an answer v [:] Based on the hypotheses, find the following: Test Statistic=[:] The correct decision is to Select an answer v . The correct conclusion would be: Select an answer v . You are a researcher studying the lifespan of a certain species of bacteria. A preliminary sample of 35 bacteria reveals a sample mean of E: = 80 hours with a standard deviation of s = 6 hours. You would like to estimate the mean lifespan for this species of bacteria to within a margin of error of 0.5 hours at a 99% level of confidence. What sample size should you gather to achieve a 0.5 hour margin of error? Round your answer up to the nearest whole number. n = C] bacteria If n=16, i(x-bar)=30, and 5:18, construct a confidence interval at a 95% confidence level. Assume the data came from a normally distributed population. Give your answers to one decimal place. You intend to estimate a population mean with a confidence interval. You believe the population to have a normal distribution. Your sample size is 9. Find the critical value that corresponds to a confidence level of 99%. (Report answer accurate to three decimal places with appropriate rounding.) il:] The amount of pollutants that are found in waterways near large cities is normally distributed with mean 8.6 ppm and standard deviation 1.7 ppm. 18 randomly selected large cities are studied. Round all answers to 4 decimal places where possible. a. What is the distribution of X? X ~ WELD} b. What is the distribution of 5'? it ~ N([:],[:]) c. What is the probability that one randomly selected city's waterway will have less than 7.7 ppm pollutants? C] d. For the 18 cities, find the probability that the average amount of pollutants is less than 7.7 ppm. :1 e. For part d), is the assumption that the distribution is normal necessary? 0 YesO No f. Find the IQR for the average of 18 cities. ppm ppm ppm According to the article "Are Babies Normal?" by Traci Clemons and Marcello Pagano published in The American Statistician, Vol. 53, No. 4, pp. 298-302, the birth weights of babies are normally distributed with a mean of 3315 grams and a standard deviation of 584 grams. \"V 1. What is the probability that a randomly selected baby weighs between 3200 grams and 3700 grams? Round your answer to 4 decimal places. :] 2. What is the probability that the average weight of 27 randomly selected babies is between 3200 grams and 3700 grams? Round your answer to 4 decimal places. [:1 3. Why did the probability increase? 0 The probability increased since the sample size increased and the distribution of sample means is more spread out. 0 The probability increased since the sample size increased and the sample means are more concentrated near the mean of 3316. My produces steel rods. The lengths of the steel rods are normally distributed with a mean of . - and a standard deviation of 1-cm. For shipment, 18 steel rods are bundled together. Find the probability that the average length of a randomly selected bundle of steel rods is between 225.1- cm and 225.3-cm. P(225.1-cm
Step by Step Solution
There are 3 Steps involved in it
Step: 1
Get Instant Access to Expert-Tailored Solutions
See step-by-step solutions with expert insights and AI powered tools for academic success
Step: 2
Step: 3
Ace Your Homework with AI
Get the answers you need in no time with our AI-driven, step-by-step assistance