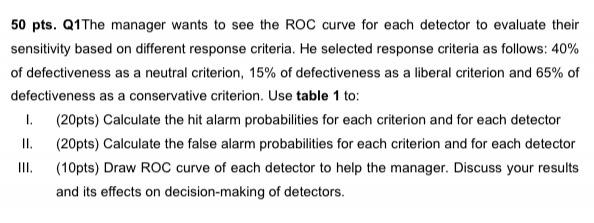
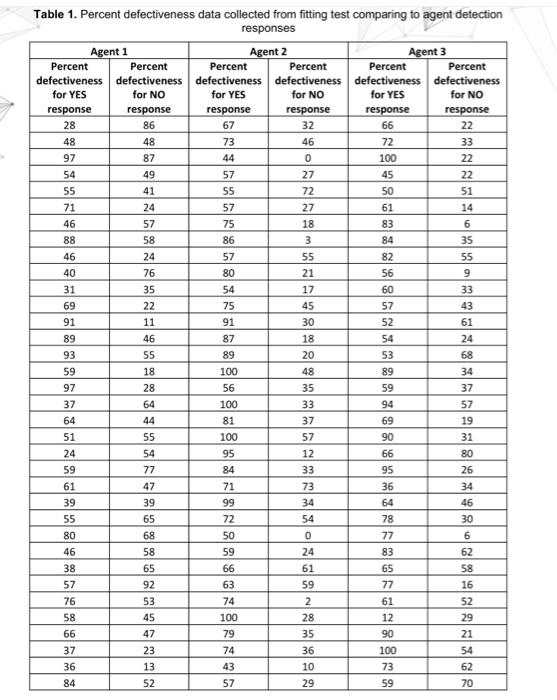
50 pts. Q1The manager wants to see the ROC curve for each detector to evaluate their sensitivity based on different response criteria. He selected response criteria as follows: 40% of defectiveness as a neutral criterion, 15% of defectiveness as a liberal criterion and 65% of defectiveness as a conservative criterion. Use table 1 to: 1. (20pts) Calculate the hit alarm probabilities for each criterion and for each detector II. (20pts) Calculate the false alarm probabilities for each criterion and for each detector (10pts) Draw ROC curve of each detector to help the manager. Discuss your results and its effects on decision-making of detectors. Table 1. Percent defectiveness data collected from fitting test comparing to agent detection responses 18 Agent 1 Agent 2 Agent 3 Percent Percent Percent Percent Percent Percent defectiveness defectiveness defectiveness defectiveness defectiveness defectiveness for YES for NO for YES for NO for YES for NO response response response response response response 28 86 67 32 66 22 48 48 73 46 72 33 97 87 44 0 100 22 54 49 57 27 45 22 55 41 55 72 50 51 71 24 57 27 61 14 46 57 75 83 6 88 58 86 3 84 35 46 24 57 55 82 55 40 76 80 21 56 9 31 35 54 17 60 33 69 22 75 45 57 43 91 11 91 30 52 61 89 46 87 18 54 24 93 55 89 20 53 68 59 18 100 48 89 34 97 28 56 35 59 37 37 64 100 33 94 57 64 44 81 37 69 19 51 55 100 57 90 31 24 54 95 12 66 80 59 77 84 33 95 26 61 47 71 73 36 34 39 39 99 34 64 46 55 65 72 54 78 30 80 68 50 0 77 6 46 58 59 24 83 62 38 65 66 61 65 58 57 92 63 59 16 76 53 74 2 61 52 58 45 100 28 12 29 66 47 79 35 90 21 37 23 74 36 100 54 36 13 43 10 73 62 84 52 57 29 59 70 77 50 pts. Q1The manager wants to see the ROC curve for each detector to evaluate their sensitivity based on different response criteria. He selected response criteria as follows: 40% of defectiveness as a neutral criterion, 15% of defectiveness as a liberal criterion and 65% of defectiveness as a conservative criterion. Use table 1 to: 1. (20pts) Calculate the hit alarm probabilities for each criterion and for each detector II. (20pts) Calculate the false alarm probabilities for each criterion and for each detector (10pts) Draw ROC curve of each detector to help the manager. Discuss your results and its effects on decision-making of detectors. Table 1. Percent defectiveness data collected from fitting test comparing to agent detection responses 18 Agent 1 Agent 2 Agent 3 Percent Percent Percent Percent Percent Percent defectiveness defectiveness defectiveness defectiveness defectiveness defectiveness for YES for NO for YES for NO for YES for NO response response response response response response 28 86 67 32 66 22 48 48 73 46 72 33 97 87 44 0 100 22 54 49 57 27 45 22 55 41 55 72 50 51 71 24 57 27 61 14 46 57 75 83 6 88 58 86 3 84 35 46 24 57 55 82 55 40 76 80 21 56 9 31 35 54 17 60 33 69 22 75 45 57 43 91 11 91 30 52 61 89 46 87 18 54 24 93 55 89 20 53 68 59 18 100 48 89 34 97 28 56 35 59 37 37 64 100 33 94 57 64 44 81 37 69 19 51 55 100 57 90 31 24 54 95 12 66 80 59 77 84 33 95 26 61 47 71 73 36 34 39 39 99 34 64 46 55 65 72 54 78 30 80 68 50 0 77 6 46 58 59 24 83 62 38 65 66 61 65 58 57 92 63 59 16 76 53 74 2 61 52 58 45 100 28 12 29 66 47 79 35 90 21 37 23 74 36 100 54 36 13 43 10 73 62 84 52 57 29 59 70 77


