

Answered step by step
Verified Expert Solution
Question
1 Approved Answer
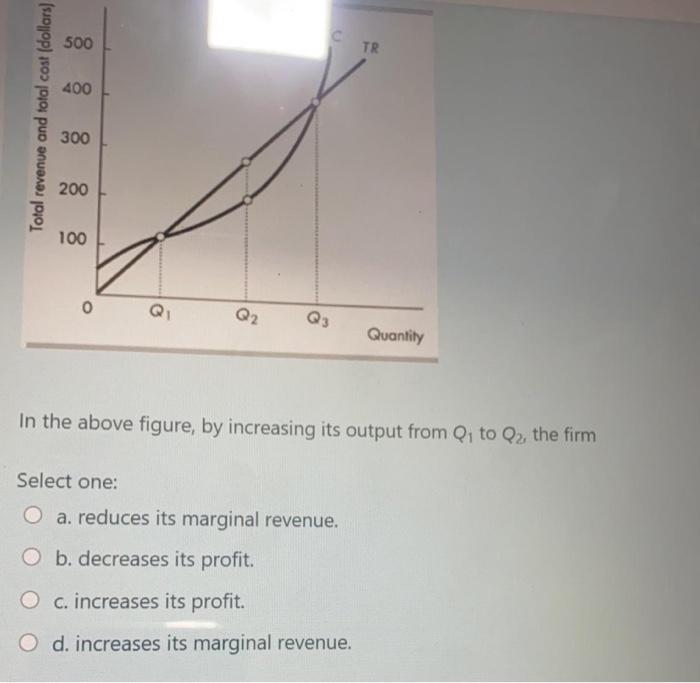
500 TR 400 Total revenue and total cost (dollars) 300 200 100 Q3 Quantity In the above figure, by increasing its output from Q, to
Step by Step Solution
There are 3 Steps involved in it
Step: 1

Get Instant Access to Expert-Tailored Solutions
See step-by-step solutions with expert insights and AI powered tools for academic success
Step: 2

Step: 3
Ace Your Homework with AI
Get the answers you need in no time with our AI-driven, step-by-step assistance
Get Started
Mostly Harmless Econometrics An Empiricist's Companion
Authors: J D Angrist, Joshua D Angrist
1st Edition
0691120358, 9780691120355