Answered step by step
Verified Expert Solution
Link Copied!

Question

1 Approved Answer

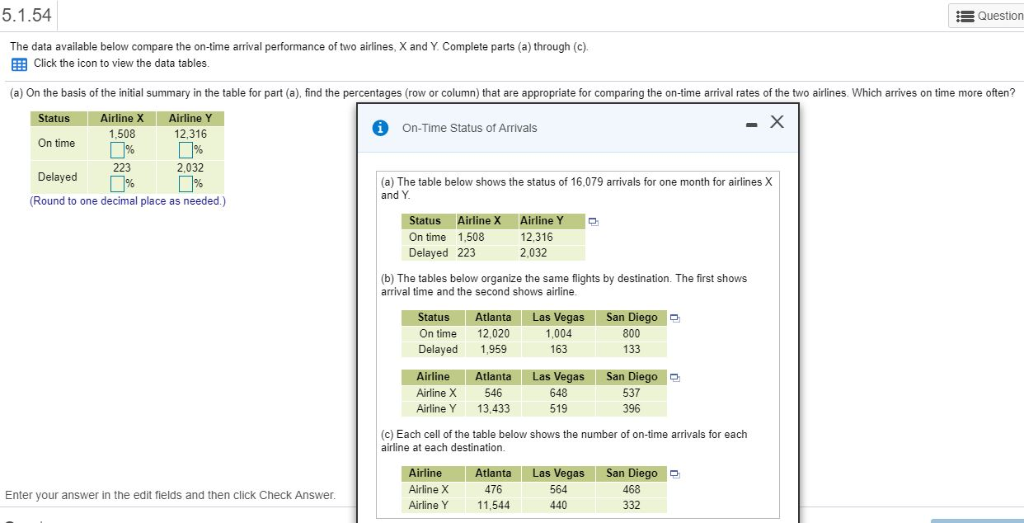
5-10 5.1.54 Question The data available below compare the on-time arrival performance of two airlines, X and Y. Complete parts (a) through (c). Click the

5-10

image text in transcribed

image text in transcribed

image text in transcribed

5.1.54 Question The data available below compare the on-time arrival performance of two airlines, X and Y. Complete parts (a) through (c). Click the icon to view the data tables. (a) On the basis of the initial summary in the table for part (a), find the percentages (row or column) that are appropriate for comparing the on-time arrival rates of the two airlines Which arrives on time more often? StatusAirline X On time Delayed Airline Y 12,316 On-Time Status of Arrivals 1,508 223 2,032 7% (a) The table below shows the status of 16,079 arrivals for one month for airlines X and Y Round to one decimal place as needed.) Status Airline X Airline Y On time 1,508 Delayed 223 12,316 2,032 (b)The tables below organize the same flights by destination. The first shows arrival time and the second shows airline Status Atlanta Las Vegas San Diego On time 12,020 Delayed 1,959 1,004 163 800 133 Airline Atlanta Las Vegas San Diegoo Airline X 546 Airline Y 13,433 537 396 648 (c) Each cell of the table below shows the number of on-time arrivals for each airline at each destination. Airline Airline X Airline Y Atlanta 476 11,544 Las Vegas 564 440 San Diego. 468 332 Enter your answer in the edit fields and then click Check Answer (b) The next two tables organize these same flights by destination. The first shows arrival time and the second shows airline. Does it appear that a lurking variable might be at work here? How can you tell? (c) Each cell of the following table shows the number of on-time arrivals for each airline at each destination. Is Destination a lurking factor behind the original 2 x 2 table

Step by Step Solution

There are 3 Steps involved in it

Step: 1

blur-text-image

Get Instant Access to Expert-Tailored Solutions

See step-by-step solutions with expert insights and AI powered tools for academic success

Step: 2

blur-text-image

Step: 3

blur-text-image

Ace Your Homework with AI

Get the answers you need in no time with our AI-driven, step-by-step assistance

Get Started

Recommended Textbook for

The Clinical Audit In Pharmaceutical Development

Authors: Michael Hamrell

1st Edition

0367399334, 978-0367399337

More Books

Students also viewed these Accounting questions