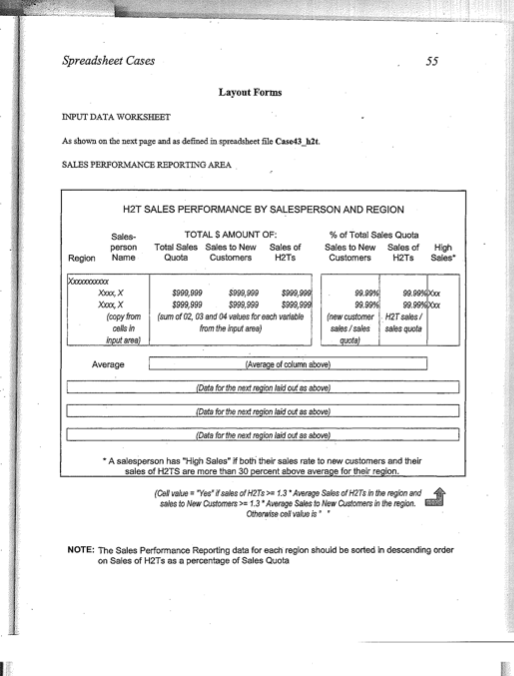
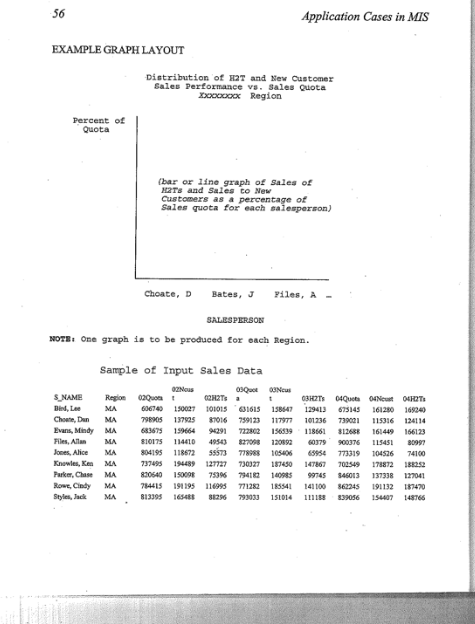
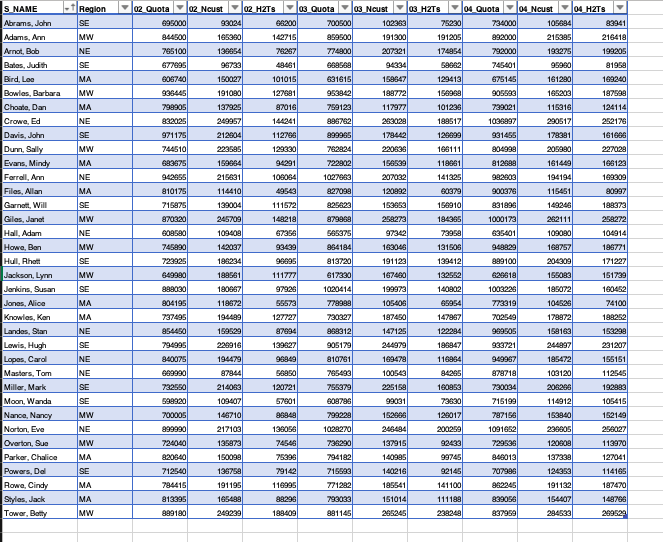
52 Application Cases in MIS CASE 3: Heavenly Herbal Tea Chariton's Coffee and Tea Company has produced coffees and teas distributed primarily through supermarkets throughout the eastern United States for 45 years. Charlton's has a sales staff of 36 salespersons assigned to one of four regional sales managers. The regional managers in turn report to Sandra Charlton the Vice President for Marketing. The sales staff at Charlton's has always been assigned on a purely geographic basis with each salesperson selling all product lines to customers within her or his territory. Five years ago Charlton's introduced a new product line, called Heavenly Herbal Teas (H2T). These teas contain herbs designed to stimulate memory. This new product line has proven to be quite successful, with sales reaching 18% of total company sales. However, Sandra believes that sales growth in this new product line has been hampered by the structure of Charlton's sales staff. Sales in the new product line have been strongest among drug and health food stores and not traditional supermarkets. Some members of the sales staff have been quick to recognize the need to seek out this new type of customer, while others have not. Sandra feels that the set of customers for the H2T product line is sufficiently different to require a separate sales staff. She proposes to establish an initial sales force of four salespersons, one for each of Charlton's sales regions. Each salesperson would then be responsible for selling the H2T line throughout his or her entire region. Sandra feels that the current sales territories need to be restructured and that some territories can be consolidated. Sandra has received approval from the CEO to make this move providing that she does not increase the total sales staff, that the salespersons for the new team are selected entirely from the existing sales staff, and that no salesperson is transferred to a different region. Salespersons who are considered "good" candidates for the new sales team will be invited to apply. Sandra has asked you to prepare a spreadsheet for her that will identify these "good" candidates. She feels that two characteristics are particularly important. First, the H2T sales staff will have to seek out many new customers and thus the salespersons selected should have a history of seeking out new customers. Second, andSpreadsheet Cases 53 most importantly, H2T salespersons should be individuals who have been enthusiastic about selling this new line. Thus, the salespersons selected should have a strong track record in sales of H2Ts. Sandra also feels that the sales quota should be considered when evaluating the performance of the sales staff. Quotas are maintained for each sales territory, and they are felt to be good measures of the sales potentials of different territories. She asks you to consider sales for the last two reporting years in your analysis. Sandra also adds that she would like you to include a table or chart that will help her to see how much variability there is across the sales staff of each region in these two target elements. She says she wants something that will "let me know it there is enough variation in sales to new customers and sales of H2Ts to justify using them as criteria to find the sales people I need." The information systems department was able to extract summary data from organizational databases and place it in spreadsheet format for you. This data is available on the web site for this casebook. The first 9 rows of this spreadsheet are reproduced below. For each salesperson three rows of data have been extracted, one for each year. In addition to the YEAR, the following items have been retrieved. S_NAME - the salesperson's name, REGION - the region to which the salesperson is assigned, QUOTA - the sales quota, NCUST -sales to new customers, and H2TS - sales of the H2T product line. Application Development Notes A sample layout form for this application is shown below. Two work sections, or worksheet pages, and a graph area are needed for this spreadsheet file. The input data should look like the sample data shown and this portion of the spreadsheet has been created for you. The second section of the application is a worksheet for the sales performance report that you are to create. The data used for this report is to come from the sum of sales from 2002 through 2004. Thus, the values for cells displaying the dollar sales amounts must be found by adding up the cells containing the 2002, 2003 and 2004 amounts. There are multiple criteria to be used in evaluating sales performance. Thus both the rate of Sales to New Customers and the Rate of Sales of H2Ts are presented. A last column called High Sales is added which is designed to identify salespersons that have shown strong performance on both criteria. Salespersons whose percentage sales in54 Application Cases in MIS both of the target categories are more than 30 percent above average are to be identified as having high sales. Finally, in order to highlight top candidates, the data area for salespersons in each region is sorted from high to low based on Sales of H2Ts as a percentage of Sales Quota, since this is considered the most important target variable. The graph is based on the data in the Sales performance reporting area and shows both sales to new customers and sales of H2Ts as a percentage of each salesperson's sales quota. Assignment 1. Using the input data and layout forms provided, develop a spreadsheet application to provide Sandra Charlton with information highlighting those salespersons who are good candidates to join the new sales team. Be sure to test your application for accuracy and completeness. Add a documentation section to your spreadsheet to make it as self-documenting as possible. 2. Write a memorandum to Sandra Smith describing the results of your application. Incorporate a copy of your Sales Performance Report in your memorandum. Make preliminary recommendations to Ms. Charlton based upon this report. Also suggest to her any limitations you see in the analysis and any other factors that you would suggest she look at. 3. Prepare a set of business presentation materials for an oral presentation to Ms. Charlton of the information described in 2 above.Spreadsheet Cases 55 Layout Forms INPUT DATA WORKSHEET As shown on the next page and as defined in spreadsheet file Case$3_hit. SALES PERFORMANCE REPORTING AREA H2T SALES PERFORMANCE BY SALESPERSON AND REGION Sales- TOTAL $ AMOUNT OF: " of Total Sales Quota person Total Sales Sales to Now Sales of Sales to Now Sales of High Region Name Quota Customers H2TS Customer HITS Xxxx, X SPAR, POP (copy from (sum of 02, 03 and Of values for each variable calls in from the Input areal igout arnal Average [Average of column shovel Date for the next region laid out as above Data for the next region laid out as shovel Date for the need region laid out as shovel "A salesperson has "High Sales" If both their sales rate to new customers and their sales of H2TS are more than 30 percent sbove average for their region. (Call value w "Yes" I' sales of H2Ts xx 1.3" Average Sales of H2Ts in the region and sales to New Customers >= 1.3" Average Sales to New Customers in the region. Otherwise cof value is " NOTE: The Sales Performance Reporting date for each region should be sorted In descending order on Sales of H2Ts as a percentage of Sales Quota56 Application Cases in MIS EXAMPLE GRAPH LAYOUT Distribution of HIT and New Customer Sales Performance vs. Sales Quota Soooooox Region Percent of Quota (bar or line graph of Sales of Mars and Sales co New Customers as a percentage of Sales quota for each salesperson) Choate, D Bates, J Files, A - SALESPERSON NOTE: One graph is to be produced for each Region. Sample of Input Sales Data OUNcui S NAME Repon Bird, Lee MA 606740 190037 101015 1015 156447 139410 623143 164280 Choate, Dun MA 197825 759123 101736 739031 115316 1241 14 Evans, Mindy MA 159464 156839 118601 161449 156123 Files, Allan MA TOITS 1 14410 60179 115451 BOORT Jones, Alice MA 904195 1 18572 58573 105- 771319 104516 74100 Knowles, Ken MA 154489 127277 790137 187630 147807 702549 173872 Parker, Chase MA 830540 1 50091 99745 846013 137338 137041 Store, Cindy MA 194 195 11 0995 771282 185341 141 103 862245 191 132 147470 Styles, Jack MA 151014 111 184 1544075 NAME -1 Region 02 Quota 02 Ncust 02 H2Ts 03 Quota |03 Ncust 03 H2TS 5 04 Quota 04 Neust 04 H2TS Abrams, John 69500 06200 70050 102363 73400 10568 Adams, An MW 844500 195380 959500 91300 191205 892000 215395 216418 Amnot, Bob NE 79510 774800 207321 792000 193275 193205 Aalos, Judith SE 677095 96739 94234 745401 95990 Bird, Loo MA GOS74 101015 159547 129413 97514 161290 169240 Bowles, Barbara MW 191090 12768 65203 Choate, Dan MA 137925 97016 117977 739021 115316 Crowe, Ed NE 249957 263028 189517 1035897 290517 252176 Davis, John 212904 161095 Dunn, Sally MW 744510 223595 162824 205980 Evans, Mindy MA 722802 15953 161449 Forroll, Ann NE 215631 109064 1027063 207032 141325 982603 194194 109309 Files, Allan MA 114410 49543 927098 120992 900376 9099 Garnoll, Will SE 715875 139004 111572 925623 931896 149246 198373 Giles, Jang MW 245709 149218 178968 19439 1000173 2621 11 Hall, Adam NE 109408 6735 97342 73958 835401 109080 104914 Hows, Ban MW 745490 142037 9343 183046 131509 949829 16875. 189771 Hull, Aholl SE 723925 186234 813720 191 123 139412 899100 204309 Jackson, Lynn MW 649390 189561 11177 $17330 167460 13255 829018 15508 151739 SE 989030 180967 9792 1020414 199972 140802 1003229 195072 160452 Jones, Alice MA 904195 1 18672 56573 778989 105409 85954 773319 104529 74100 Knowles, Kon MA 737495 127727 730327 187450 70254 78972 198252 Landos, Stan NE 954450 15952 97894 398312 14712 129284 95950 153295 Lowis, Hugh SE 194995 220916 13952 189847 933721 244897 231207 NE 940075 194479 910761 169478 116864 195472 165151 Masters, Tom NE 969090 705493 978718 103120 1 12545 Miller, Mark SE 214063 765379 225159 160953 73003 20820 192483 Moon, Wanda 598920 109407 715193 114912 105415 Nanoo, Nangy MW 700005 146710 129017 79715 153940 152149 Norton, Eve 217103 1028270 1091652 239905 Oworton, Sup MW 135872 735290 137915 9243 729535 120908 13970 Parker, Chalioo MA 150098 794182 946013 Powers, Dol 136758 7914 715593 707989 114185 Rowa, Cindy MA 794416 191195 191132 Styles, Jack MA 913395 195489 111189 939059 154407 Tower, Bots MW 989180 249239 19840 981 145 295245 238249 937959 284533 109529
