Answered step by step
Verified Expert Solution
Link Copied!

Question

1 Approved Answer

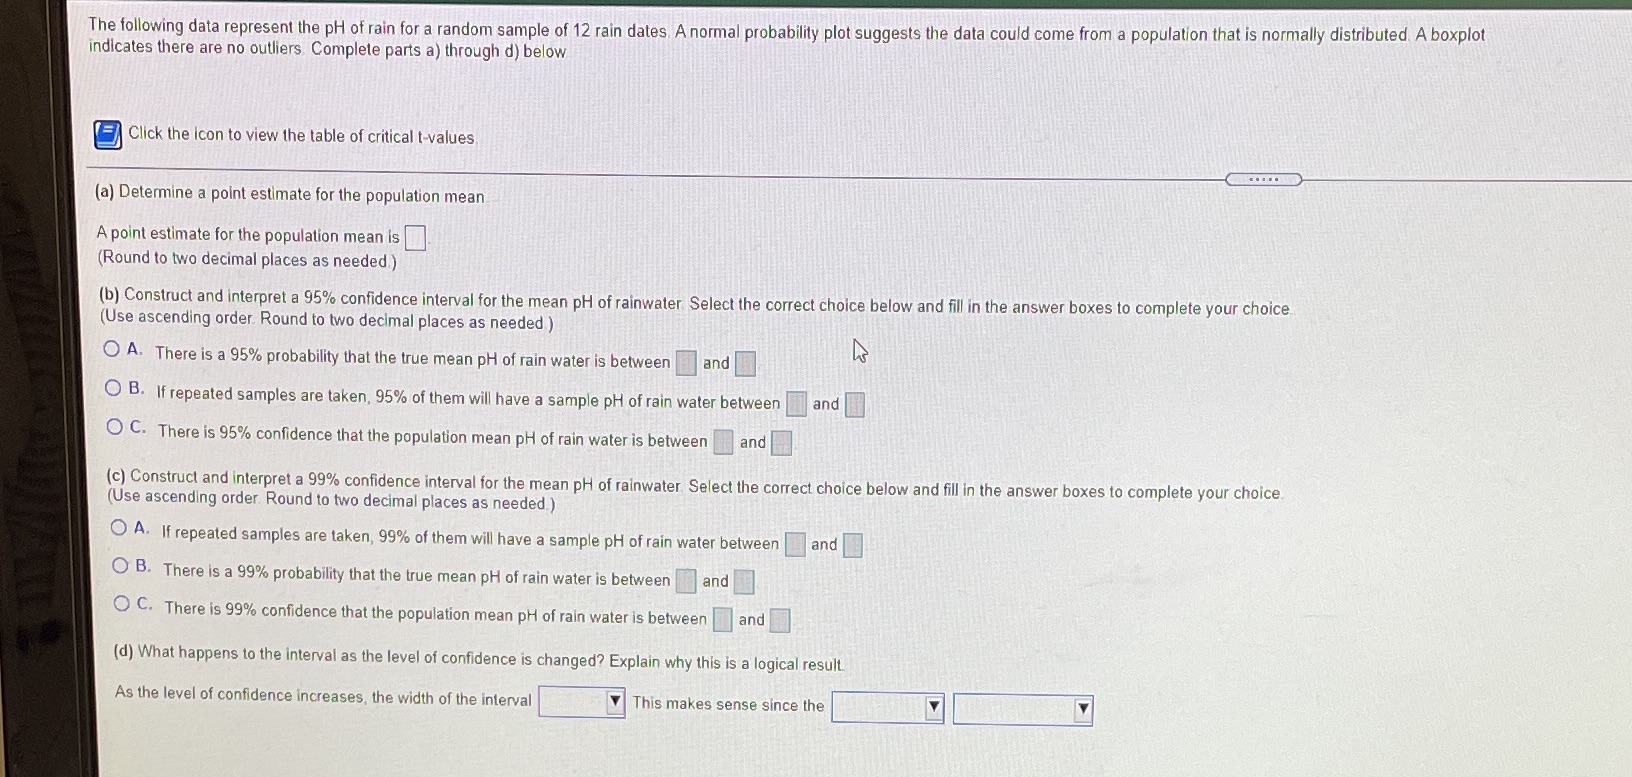
5.20 5.72 4.89 4.805.02 4.59 4.74 5.194.61 4.76 4.56 5.71 The following data represent the pH of rain for a random sample of 12 rain

5.20 5.72 4.89 4.805.02 4.59 4.74 5.194.61 4.76 4.56 5.71

image text in transcribed
The following data represent the pH of rain for a random sample of 12 rain dates, A normal probability plot suggests the data could come from a population that is normally distributed A boxplot indicates there are no outliers Complete parts a) through d) below Click the icon to view the table of critical t-values (a) Determine a point estimate for the population mean A point estimate for the population mean is (Round to two decimal places as needed ) (b) Construct and interpret a 95% confidence interval for the mean pH of rainwater Select the correct choice below and fill in the answer boxes to complete your choice (Use ascending order Round to two decimal places as needed ) O A. There is a 95% probability that the true mean pH of rain water is between and O B. If repeated samples are taken, 95% of them will have a sample pH of rain water between and O C. There is 95% confidence that the population mean pH of rain water is between and (c) Construct and interpret a 99% confidence interval for the mean pH of rainwater Select the correct choice below and fill in the answer boxes to complete your choice. (Use ascending order Round to two decimal places as needed.) O A. If repeated samples are taken, 99% of them will have a sample pH of rain water between and O B. There is a 99% probability that the true mean pH of rain water is between and O C. There is 99% confidence that the population mean pH of rain water is between and (d) What happens to the interval as the level of confidence is changed? Explain why this is a logical result. As the level of confidence increases, the width of the interval This makes sense since the

Step by Step Solution

There are 3 Steps involved in it

Step: 1

blur-text-image

Get Instant Access to Expert-Tailored Solutions

See step-by-step solutions with expert insights and AI powered tools for academic success

Step: 2

blur-text-image

Step: 3

blur-text-image

Ace Your Homework with AI

Get the answers you need in no time with our AI-driven, step-by-step assistance

Get Started

Recommended Textbook for

Trigonometry

Authors: Cynthia Y Young

5th Edition

1119820928, 9781119820925

More Books

Students also viewed these Mathematics questions

Question

What marketing channel functions are necessary in global marketing?

Answered: 1 week ago

Question

9. Identify independent and dependent variables.

Answered: 1 week ago