5-7 please!!

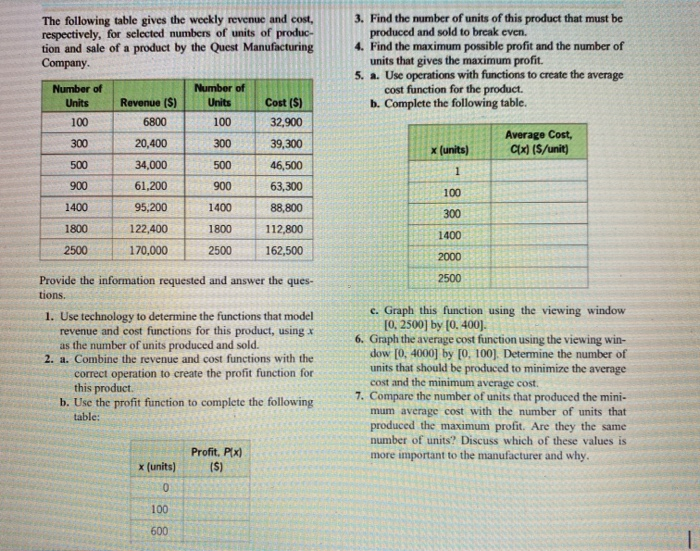
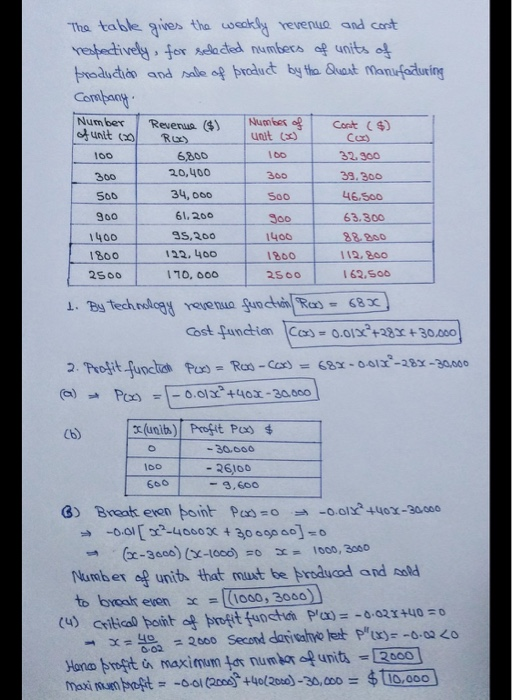
The following table gives the weekly revenue and cost respectively, for selected numbers of units of produc- tion and sale of a product by the Quest Manufacturing Company. 3. Find the number of units of this product that must be produced and sold to break even 4. Find the maximum possible profit and the number of units that gives the maximum profit. 5. a. Use operations with functions to create the average cost function for the product. b. Complete the following table. Number of Units 100 300 Number of Units 100 300 500 900 1400 x (units) Average Cost Cix) ($/unit) Revenue ($) 6800 20,400 34,000 61,200 95,200 122,400 170,000 500 Cost (5) 32,900 39,300 46,500 63,300 88,800 112,800 162,500 900 1400 1800 1800 100 300 1400 2000 2500 2500 2500 Provide the information requested and answer the ques. tions. 1. Use technology to determine the functions that model revenue and cost functions for this product, using X as the number of units produced and sold. 2. a. Combine the revenue and cost functions with the correct operation to create the profit function for this product b. Use the profit function to complete the following table: e. Graph this function using the viewing window [0, 2500] by (0.400). 6. Graph the average cost function using the viewing win- dow [0, 4000] by [0, 100). Determine the number of units that should be produced to minimize the average cost and the minimum average cost. 7. Compare the number of units that produced the mini- mum average cost with the number of units that produced the maximum profit. Are they the same number of units? Discuss which of these values is more important to the manufacturer and why. (units) Profit. PX (5) 0 The table gives the weakly revenue and cost respectively, for selected numbers of units of production and sale of product by the Quest Manufacturing Company. Number Revenue ($) Number of Cont (s) of unit (20 RUE) Unit () 100 6,800 100 32.900 300 20,400 300 39.300 500 34,000 SOO 46.500 900 61,200 300 63.300 1400 95,200 1400 88.200 1800 122.400 1800 112.200 2500 110.000 2500 162.500 1. By technology revenue function Roo = 680) Cost function (o)= 0.01x+288+30.000/ 2. Profit fuoclish Por) = Res-Cos) = 684-001X-28 - 30.000 (a) - Pox = -0.012 +408-30.000 (b) (units) Profit PC) $ -30.000 100 - 26100 600 - 9,600 6) Break eren point Ped=0 -0.01x +40 x-30.000 -0.0172-400030 + 3009000] =0 (3-3000) (X-1000) =0 *= 1000, 3000 Number of units that must be produced and sold to break even x= [(1000, 3000) (4) Critical point of brotit function P(x) = -0.024+40 =0 - X=40 = 2000 Second doricalyelest p"(x)=-6-600 Hence profit in maximum for number of units = 2000] Maxi on profit = -0.61(2000* +40(2006) - 30,000 = $110.000 The following table gives the weekly revenue and cost respectively, for selected numbers of units of produc- tion and sale of a product by the Quest Manufacturing Company. 3. Find the number of units of this product that must be produced and sold to break even 4. Find the maximum possible profit and the number of units that gives the maximum profit. 5. a. Use operations with functions to create the average cost function for the product. b. Complete the following table. Number of Units 100 300 Number of Units 100 300 500 900 1400 x (units) Average Cost Cix) ($/unit) Revenue ($) 6800 20,400 34,000 61,200 95,200 122,400 170,000 500 Cost (5) 32,900 39,300 46,500 63,300 88,800 112,800 162,500 900 1400 1800 1800 100 300 1400 2000 2500 2500 2500 Provide the information requested and answer the ques. tions. 1. Use technology to determine the functions that model revenue and cost functions for this product, using X as the number of units produced and sold. 2. a. Combine the revenue and cost functions with the correct operation to create the profit function for this product b. Use the profit function to complete the following table: e. Graph this function using the viewing window [0, 2500] by (0.400). 6. Graph the average cost function using the viewing win- dow [0, 4000] by [0, 100). Determine the number of units that should be produced to minimize the average cost and the minimum average cost. 7. Compare the number of units that produced the mini- mum average cost with the number of units that produced the maximum profit. Are they the same number of units? Discuss which of these values is more important to the manufacturer and why. (units) Profit. PX (5) 0 The table gives the weakly revenue and cost respectively, for selected numbers of units of production and sale of product by the Quest Manufacturing Company. Number Revenue ($) Number of Cont (s) of unit (20 RUE) Unit () 100 6,800 100 32.900 300 20,400 300 39.300 500 34,000 SOO 46.500 900 61,200 300 63.300 1400 95,200 1400 88.200 1800 122.400 1800 112.200 2500 110.000 2500 162.500 1. By technology revenue function Roo = 680) Cost function (o)= 0.01x+288+30.000/ 2. Profit fuoclish Por) = Res-Cos) = 684-001X-28 - 30.000 (a) - Pox = -0.012 +408-30.000 (b) (units) Profit PC) $ -30.000 100 - 26100 600 - 9,600 6) Break eren point Ped=0 -0.01x +40 x-30.000 -0.0172-400030 + 3009000] =0 (3-3000) (X-1000) =0 *= 1000, 3000 Number of units that must be produced and sold to break even x= [(1000, 3000) (4) Critical point of brotit function P(x) = -0.024+40 =0 - X=40 = 2000 Second doricalyelest p"(x)=-6-600 Hence profit in maximum for number of units = 2000] Maxi on profit = -0.61(2000* +40(2006) - 30,000 = $110.000


