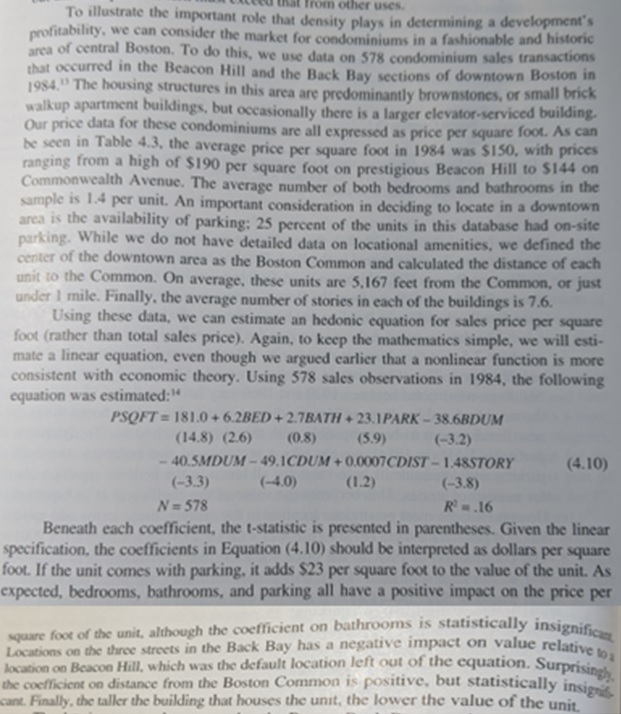
5(d). Note that we can define a hedonic equation for the price per square foot of floor area (P) in a housing unit: P = -F.
Now compare this equation with the estimated equation (4.10).
Given:
Floor Area Ratio (FAR)
FAR = Gross Floor Area / Plot Area
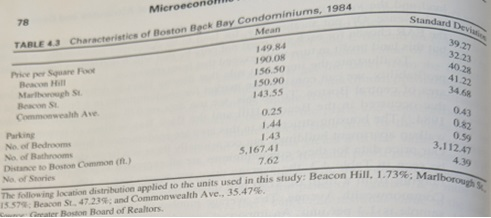
The average number of stories Back Bay area is 7.62
Question:
Find optimum FAR or F* for Marlborough and Beacon & Are the suggested optimum F* larger or smaller than 7.62 in case of Marlborough and Beacon?
Please See Information Below:


from other USCS Locations on the three streets in the Back Bay has a negative impact on value relative to square foot of the unit, although the coefficient on bathrooms is statistically insignificant To illustrate the important role that density plays in determining a development's profitability, we can consider the market for condominiums in a fashionable and historic area of central Boston. To do this, we use data on 578 condominium sales transactions that occurred in the Beacon Hill and the Back Bay sections of downtown Boston in 1984. The housing structures in this area are predominantly brownstones, or small brick walkup apartment buildings, but occasionally there is a larger elevator serviced building. Our price data for these condominiums are all expressed as price per square foot. As can be seen in Table 4.3, the average price per square foot in 1984 was S150, with prices ranging from a high of $190 per square foot on prestigious Beacon Hill to S144 on Commonwealth Avenue. The average number of both bedrooms and bathrooms in the sample is 1.4 per unit. An important consideration in deciding to locate in a downtown area is the availability of parking: 25 percent of the units in this database had on-site parking. While we do not have detailed data on locational amenities, we defined the center of the downtown area as the Boston Common and calculated the distance of each unit to the Common. On average, these units are 5.167 feet from the Common, or just under 1 mile. Finally, the average number of stories in each of the buildings is 7.6. Using these data, we can estimate an hedonic equation for sales price per square foot (rather than total sales price). Again, to keep the mathematics simple, we will esti- mate a linear equation, even though we argued earlier that a nonlinear function is more consistent with economic theory. Using 578 sales observations in 1984, the following equation was estimated: PSQFT = 181.0 +6.2BED + 2.7BATH - 23.1 PARK - 38.6BDUM (14.8) (2.6) (0.8) (5.9) (-3.2) - 40.5MDUM - 49.1CDUM +0.0007CDIST - 1.48STORY (4.10) (-3.3) (-4.0) (1.2) (-3.8) N = 578 R.16 Beneath each coefficient, the t-statistic is presented in parentheses. Given the linear specification, the coefficients in Equation (4.10) should be interpreted as dollars per square foot. If the unit comes with parking, it adds $23 per square foot to the value of the unit. As expected, bedrooms, bathrooms, and parking all have a positive impact on the price per 14 the coefficient on distance from the Boston Common is positive, but statistically insignet location on Beacon Hill, which was the default location left out of the equation. Surprising) cant. Finally, the taller the building that houses the unit, the lower the value of the unit. Standard Devi Microecol TABLE 63 Characteristics of Boston Back Bay Condominiums, 1984 Mean 149.84 10.08 156 50 150.90 143.55 32 23 4023 41.22 The following location distribution applied to the units used in this study: Beacon Hill, 1.7390: Marlborou 78 March Commonwealth Ave Parking No. of Bedrooms No. of Bathrooms Distance to Be Common No. of Stories 0.25 043 0.82 0.59 3.112.47 1.43 5.167.41 7.62 1557 Beacon St. 47 23 and Commonwealth Ave., 35.475 Cater Boston Board of Realtors. from other USCS Locations on the three streets in the Back Bay has a negative impact on value relative to square foot of the unit, although the coefficient on bathrooms is statistically insignificant To illustrate the important role that density plays in determining a development's profitability, we can consider the market for condominiums in a fashionable and historic area of central Boston. To do this, we use data on 578 condominium sales transactions that occurred in the Beacon Hill and the Back Bay sections of downtown Boston in 1984. The housing structures in this area are predominantly brownstones, or small brick walkup apartment buildings, but occasionally there is a larger elevator serviced building. Our price data for these condominiums are all expressed as price per square foot. As can be seen in Table 4.3, the average price per square foot in 1984 was S150, with prices ranging from a high of $190 per square foot on prestigious Beacon Hill to S144 on Commonwealth Avenue. The average number of both bedrooms and bathrooms in the sample is 1.4 per unit. An important consideration in deciding to locate in a downtown area is the availability of parking: 25 percent of the units in this database had on-site parking. While we do not have detailed data on locational amenities, we defined the center of the downtown area as the Boston Common and calculated the distance of each unit to the Common. On average, these units are 5.167 feet from the Common, or just under 1 mile. Finally, the average number of stories in each of the buildings is 7.6. Using these data, we can estimate an hedonic equation for sales price per square foot (rather than total sales price). Again, to keep the mathematics simple, we will esti- mate a linear equation, even though we argued earlier that a nonlinear function is more consistent with economic theory. Using 578 sales observations in 1984, the following equation was estimated: PSQFT = 181.0 +6.2BED + 2.7BATH - 23.1 PARK - 38.6BDUM (14.8) (2.6) (0.8) (5.9) (-3.2) - 40.5MDUM - 49.1CDUM +0.0007CDIST - 1.48STORY (4.10) (-3.3) (-4.0) (1.2) (-3.8) N = 578 R.16 Beneath each coefficient, the t-statistic is presented in parentheses. Given the linear specification, the coefficients in Equation (4.10) should be interpreted as dollars per square foot. If the unit comes with parking, it adds $23 per square foot to the value of the unit. As expected, bedrooms, bathrooms, and parking all have a positive impact on the price per 14 the coefficient on distance from the Boston Common is positive, but statistically insignet location on Beacon Hill, which was the default location left out of the equation. Surprising) cant. Finally, the taller the building that houses the unit, the lower the value of the unit. Standard Devi Microecol TABLE 63 Characteristics of Boston Back Bay Condominiums, 1984 Mean 149.84 10.08 156 50 150.90 143.55 32 23 4023 41.22 The following location distribution applied to the units used in this study: Beacon Hill, 1.7390: Marlborou 78 March Commonwealth Ave Parking No. of Bedrooms No. of Bathrooms Distance to Be Common No. of Stories 0.25 043 0.82 0.59 3.112.47 1.43 5.167.41 7.62 1557 Beacon St. 47 23 and Commonwealth Ave., 35.475 Cater Boston Board of Realtors


