The following table shows the distribution of the number of days of sick leave taken by 100 employees during a year. a. b. C.

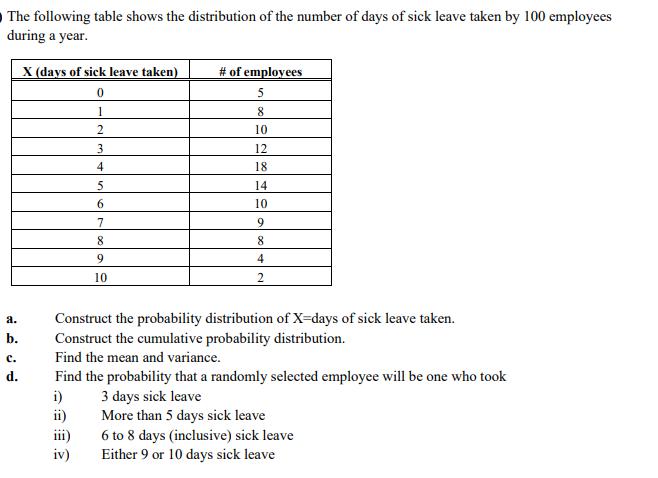
The following table shows the distribution of the number of days of sick leave taken by 100 employees during a year. a. b. C. d. X (days of sick leave taken) 0 1 2 3 4 5 6 7 8 9 10 # of employees 5 8 10 12 18 14 10 9 8 4 2 Construct the probability distribution of X-days of sick leave taken. Construct the cumulative probability distribution. Find the mean and variance. Find the probability that a randomly selected employee will be one who took i) 3 days sick leave ii) More than 5 days sick leave iii) iv) 6 to 8 days (inclusive) sick leave Either 9 or 10 days sick leave
Step by Step Solution
3.34 Rating (169 Votes )
There are 3 Steps involved in it
Step: 1

See step-by-step solutions with expert insights and AI powered tools for academic success
Step: 2

Step: 3

Ace Your Homework with AI
Get the answers you need in no time with our AI-driven, step-by-step assistance
Get Started


