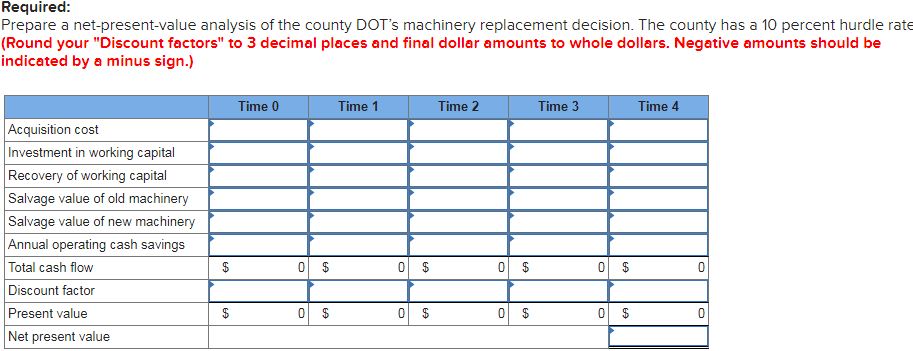
5.The supervisor of the county Department of Transportation (DOT) is considering the replacement of some machinery. This machinery has zero book value but its current market value is $820. One possible alternative is to invest in new machinery, which has a cost of $39,200. This new machinery would produce estimated annual operating cash savings of $12,600. The estimated useful life of the new machinery is four years. The DOT uses straight-line depreciation. The new machinery has an estimated salvage value of $2,020 at the end of four years. The investment in the new machinery would require an additional investment in working capital of $3,000, which would be recovered after four years.
If the DOT accepts this investment proposal, disposal of the old machinery and investment in the new equipment will take place on December 31, 20x1. The cash flows from the investment will occur during the calendar years 20x2 through 20x5.
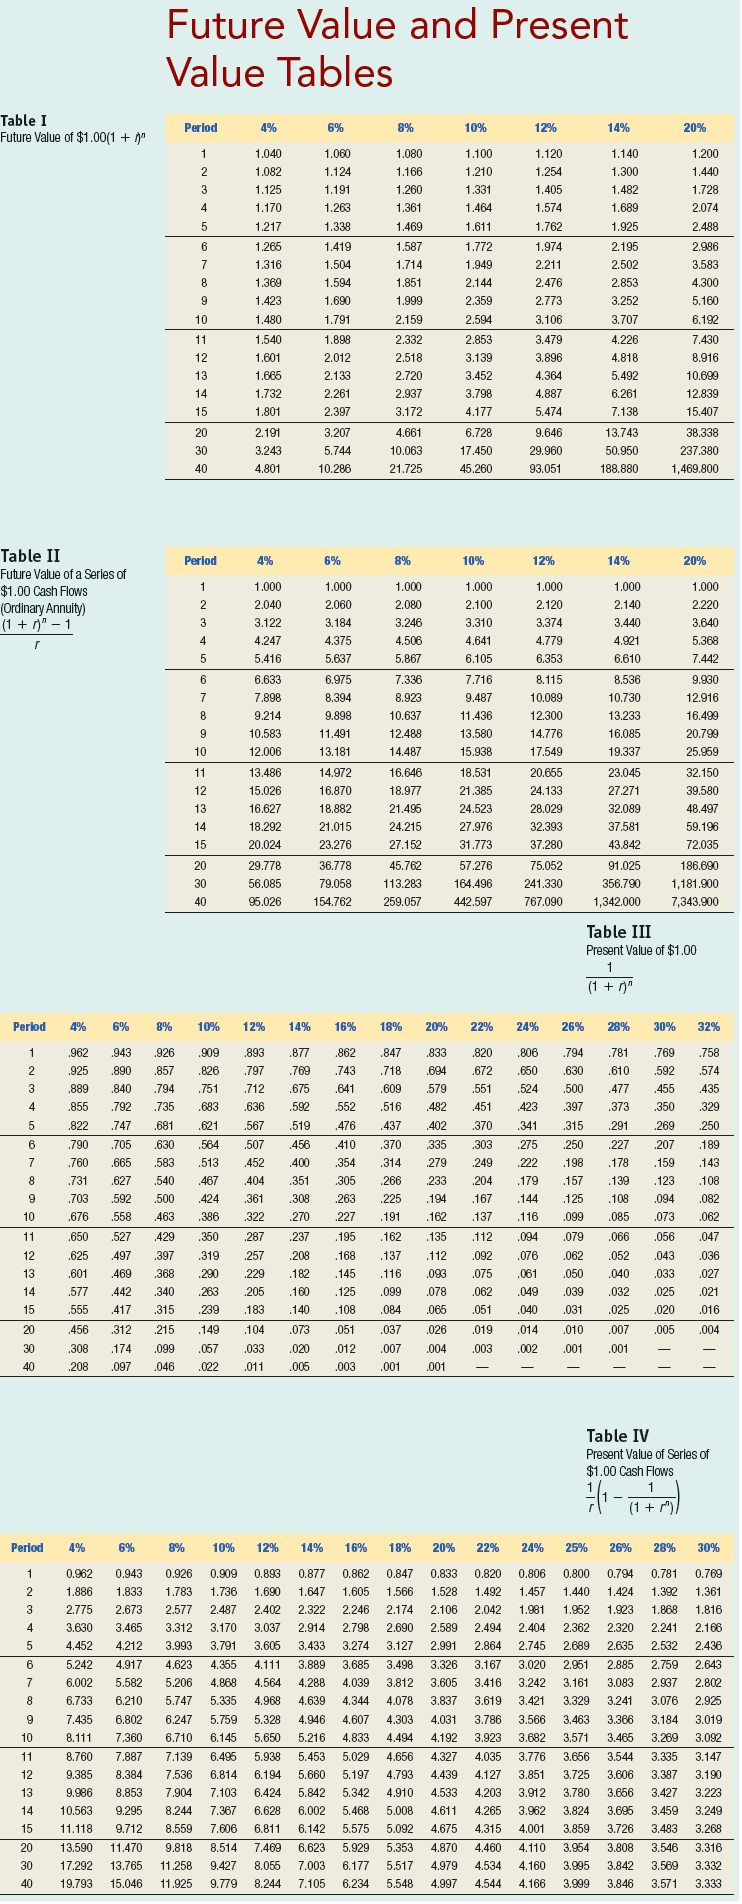
UseAppendix Afor your reference.(Use appropriate factor(s) from the tables provided.)
Required:
Make a net-present-value analysis of the county DOT's machinery replacement decision. The county has a 10 percent hurdle rate including the acquisition cost; investment in working capital; recovery of working capital, salvage value of old machinery; salvage value of new machinery; annual operating cash savings; total cash flow; discount factor; present value, and net present value.(Round your "Discount factors" to 3 decimal places and final dollar amounts to whole dollars. Negative amounts should be indicated by a minus sign.)
Future Value and Present Value Tables Table I Period 4% 6% 8% 10% 12% 14% 20% Future Value of $1.00(1 + ) 1.040 1.060 1.080 1.100 1.120 1.140 1.200 1.082 1.124 1.166 1.210 1.254 1.300 1.440 1.125 1.191 1.260 1.331 1.405 1.482 1.728 1.170 1.263 1.361 1.464 1.574 1.689 2.074 1.217 1.338 1.469 1.611 .762 1.925 2.488 1.265 1.419 1.587 1.772 1.974 2.195 2.986 1.31 1.504 1.714 1.949 2.211 2.502 3.583 1.36 1.594 1.851 2.144 2.476 2.853 4.300 1.423 1.690 1.999 2.359 2.773 3.252 5.160 1.480 1.791 2.159 2.594 3.106 3.707 6.192 1.540 1.898 2.332 2.853 3.479 4.226 7.430 1.601 2.012 2.518 3.139 3.896 4.818 8.916 1.665 2.133 2.720 3.452 4.364 5.492 10.690 1.732 2.261 2.937 3.798 4.887 6.261 12.83 1.801 2.397 3.172 4.177 5,474 7.138 15.407 2.191 3.207 4.661 6.728 9.646 13.74 38.338 3.24 5.744 10.063 17.450 29.960 50.950 37.380 10 4.801 10.286 21.725 45.260 93.051 188.880 1,469.800 Table II Period 4% 6% 8% 10% 12% 14% 20% Future Value of a Series of 1.000 1.000 1.000 1,000 1.000 1.000 1.000 $1.00 Cash Flows 2.060 2.080 2.100 2.120 2.140 2.220 (Ordinary Annuity) 2.040 (1 + 1)" - 1 3.12 3.184 3.246 3.31 3.374 3.440 3.640 4.247 4.375 1.506 4.641 4.779 4,921 5.368 5.416 5.637 5.867 6.105 6.353 6.610 7.442 3.633 6.975 7.336 7.716 8.115 8.536 9.930 7.898 3.394 8.923 9.487 10.089 10.730 2.916 9.214 9.898 10.637 1.436 2.300 13.233 16.499 10.583 11.491 12.488 13.58 14,776 16.085 20.799 10 12.006 13.181 14.487 15.938 17.549 19.337 25.959 13.486 14.972 16.646 18.531 20.655 23.045 32.150 15.026 16.870 18.977 21.385 24.133 27.271 39.580 13 16.627 18.882 21.49 24.523 28.029 32.089 48.497 18.292 21.015 24.215 27.976 32.393 37.581 59.19 20.024 23.276 27.152 31.773 37.280 43.842 72.035 20 29.778 36.778 45.762 57.276 75.052 91.025 186.690 56.085 79.058 113.283 164.496 241.330 356.790 1,181.900 95.026 154.762 259.057 442.597 767.090 1,342.000 7,343.900 Table III Present Value of $1.00 ( 1 + 1 )n Period 4% 6 8% 10% 12% 14% 16% 18% 20% 22% 24% 26% 28% 30% 32% 758 962 943 926 909 893 877 86 .847 833 820 .806 794 781 769 574 925 890 857 826 797 769 743 718 672 650 630 610 592 455 435 889 840 794 751 .712 675 641 609 579 551 524 500 477 350 329 355 792 735 683 636 592 552 516 182 451 423 397 373 747 681 621 567 519 476 437 102 370 .341 .315 .291 269 .250 822 790 705 630 564 .507 456 410 .370 335 .303 .275 .250 227 207 .189 760 665 583 513 452 400 354 .314 279 249 222 198 .178 159 143 540 108 327 .123 73 467 404 351 305 .266 233 204 179 157 .139 424 361 308 .263 .225 194 .167 .144 .125 .108 094 082 .703 592 500 676 558 463 .386 .322 270 .227 191 162 137 116 .099 .085 073 062 .047 650 527 429 350 .287 .237 195 162 .135 112 .094 .079 066 .056 625 497 397 .319 .257 .208 .168 .137 .112 .092 076 062 052 .043 .036 .601 469 368 290 .229 .182 .145 .116 .093 .075 061 050 .040 .033 .027 577 442 340 263 205 160 125 099 078 062 049 039 032 .025 021 239 183 ,140 ,108 .084 065 051 040 031 .025 020 .016 555 417 315 20 456 312 215 149 104 .073 051 037 026 019 .014 010 007 005 .004 308 174 099 057 033 .020 012 .007 004 003 .002 001 .001 208 097 046 022 011 005 .003 001 00 Table IV Present Value of Series of $1.00 Cash Flows 1/ 1 1 (1 + 1 7 / 24% 25% 26% 28% 30% Period 4% 6% 8% 10% 12% 14% 16% 18% 22% 0.962 0.943 0.926 0.909 0.893 0.877 0.862 0.847 0.833 0.820 0.806 0.800 0.794 0.781 0.769 1.833 1.783 1.736 1.690 1.647 1.605 1.566 1.528 1.492 1.457 1.440 1.424 1.392 1.361 1.886 2.775 2.673 2.577 2.487 2.402 2.322 2.246 2.174 2.106 2.042 1.981 1.952 1.923 1.868 1.816 3.630 3.465 3.312 3.170 3.037 2.914 2.798 2.690 2.589 2.494 4 2.404 2.362 2.320 2.241 2.166 4.452 4.212 3.993 3.791 3.605 3.433 1 3.127 2.991 2.864 2.745 2.689 2.635 2.532 2.436 5.242 4.917 4.623 4.355 4.111 3.889 3.685 3.498 3.326 3.167 3.020 2.951 2.885 2.759 2.643 B.002 5.582 5.206 4.868 4.564 4.288 4.039 3.812 3.605 3.416 3.242 3.161 3.083 2.937 2.802 6.210 5.335 4.968 4.639 4.344 4.078 3.619 3.421 3.329 3.241 3.076 2.925 Co 3.733 5.747 3.837 7.435 6.802 6.247 5.759 5.328 4.946 4.607 4.303 4.031 3.786 3.566 3.463 3.366 3.184 3.019 8.11 7.360 6.710 6.145 5.650 5.216 4.833 4.494 4.192 3.923 3.682 3.571 3.465 3.269 3.092 3.335 3.147 8,760 7.887 7.139 6.495 5.938 5.453 5.029 4.656 4.327 4.035 3.776 3.656 3.544 9.385 8.384 7.536 6.814 6.194 5.660 4.793 4.439 4.127 3.851 3.725 3.606 3.387 3.190 9.986 8.853 7.904 7.103 6.424 5.842 5.342 4.910 4.533 4.203 3.912 3.780 3.656 3.427 3 3.223 10.563 9.295 8.244 7.367 6.628 6.002 5.468 5.008 4.611 4.265 3.962 3.824 3.695 3.459 3.249 11.118 9.712 8.559 7.606 6.811 6.142 5.575 5.092 4.675 4.315 4.001 3.859 3.726 3.48 3.268 13.590 11.470 8.514 7.469 6 6.623 5.929 5.353 4.870 4.460 4.110 3.964 3.808 3.316 17.292 13.765 11.258 9.427 8.056 7 7.003 6.177 5.517 4.979 4.534 4.160 3.995 3.842 3.569 3.332 40 19.793 15.046 11.925 9.779 8.244 7 7.105 6.234 5.548 4.997 4.544 4.166 3.999 3.846 3.5713\f