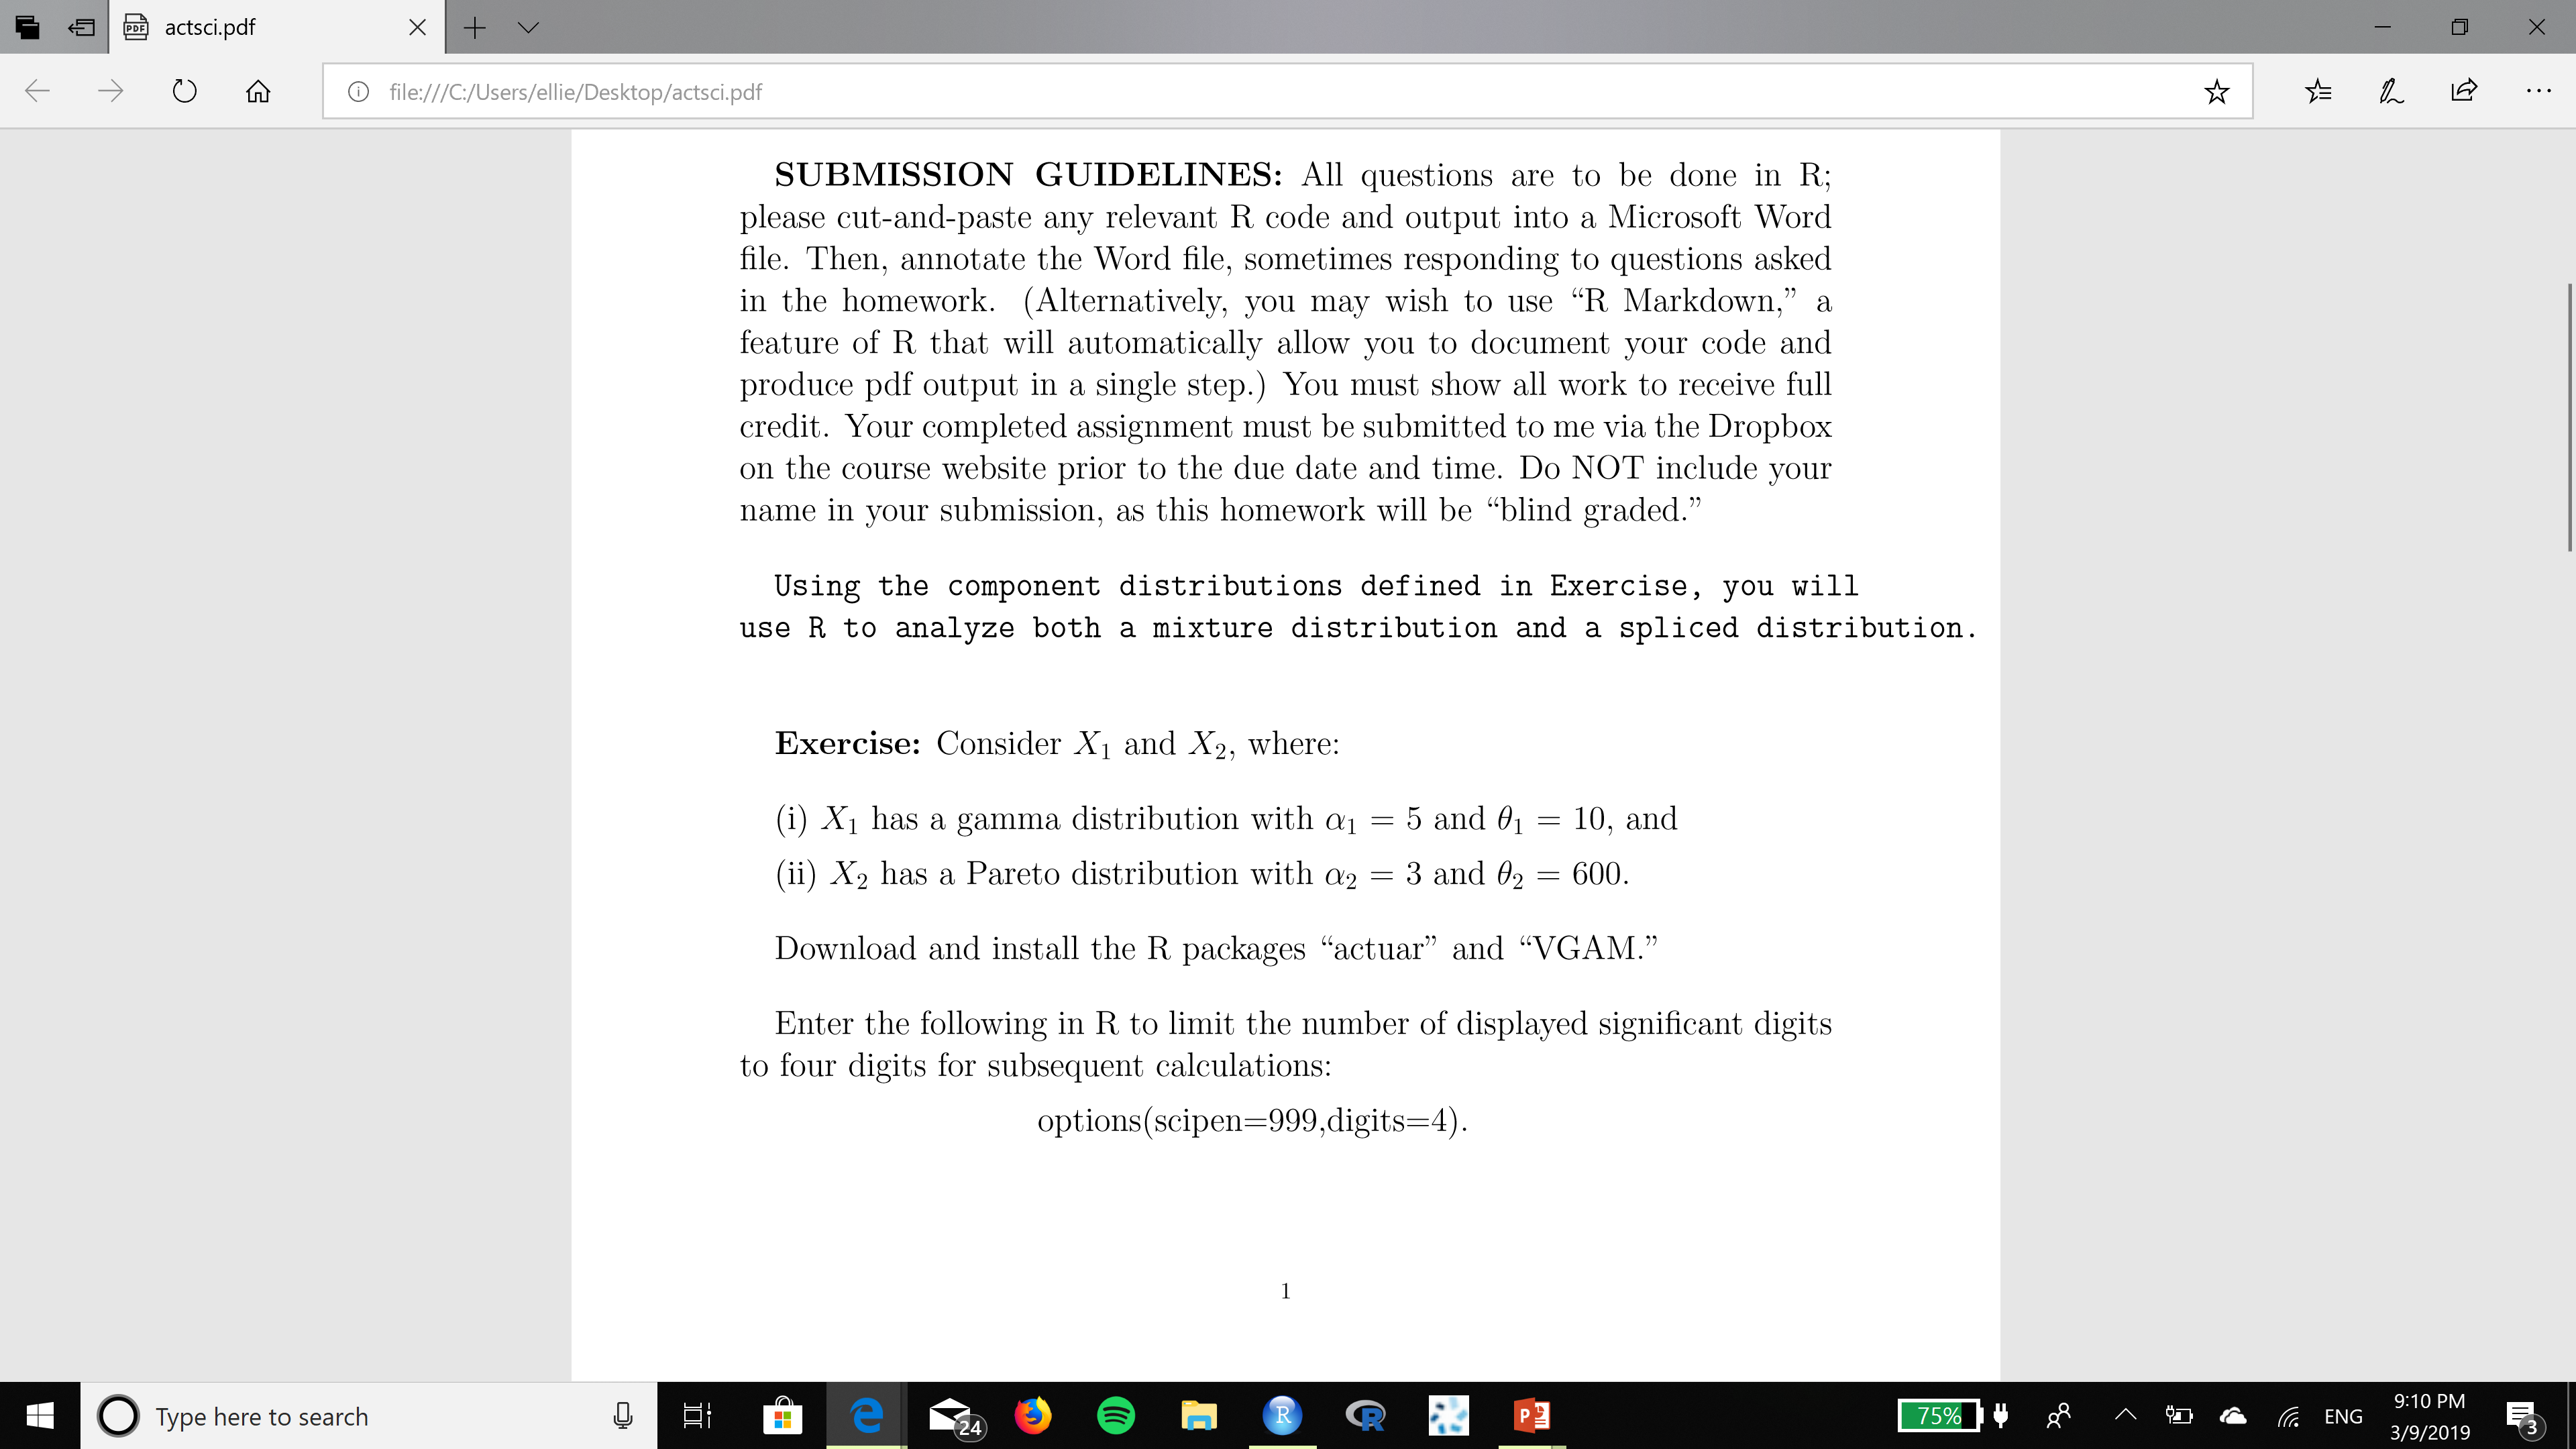
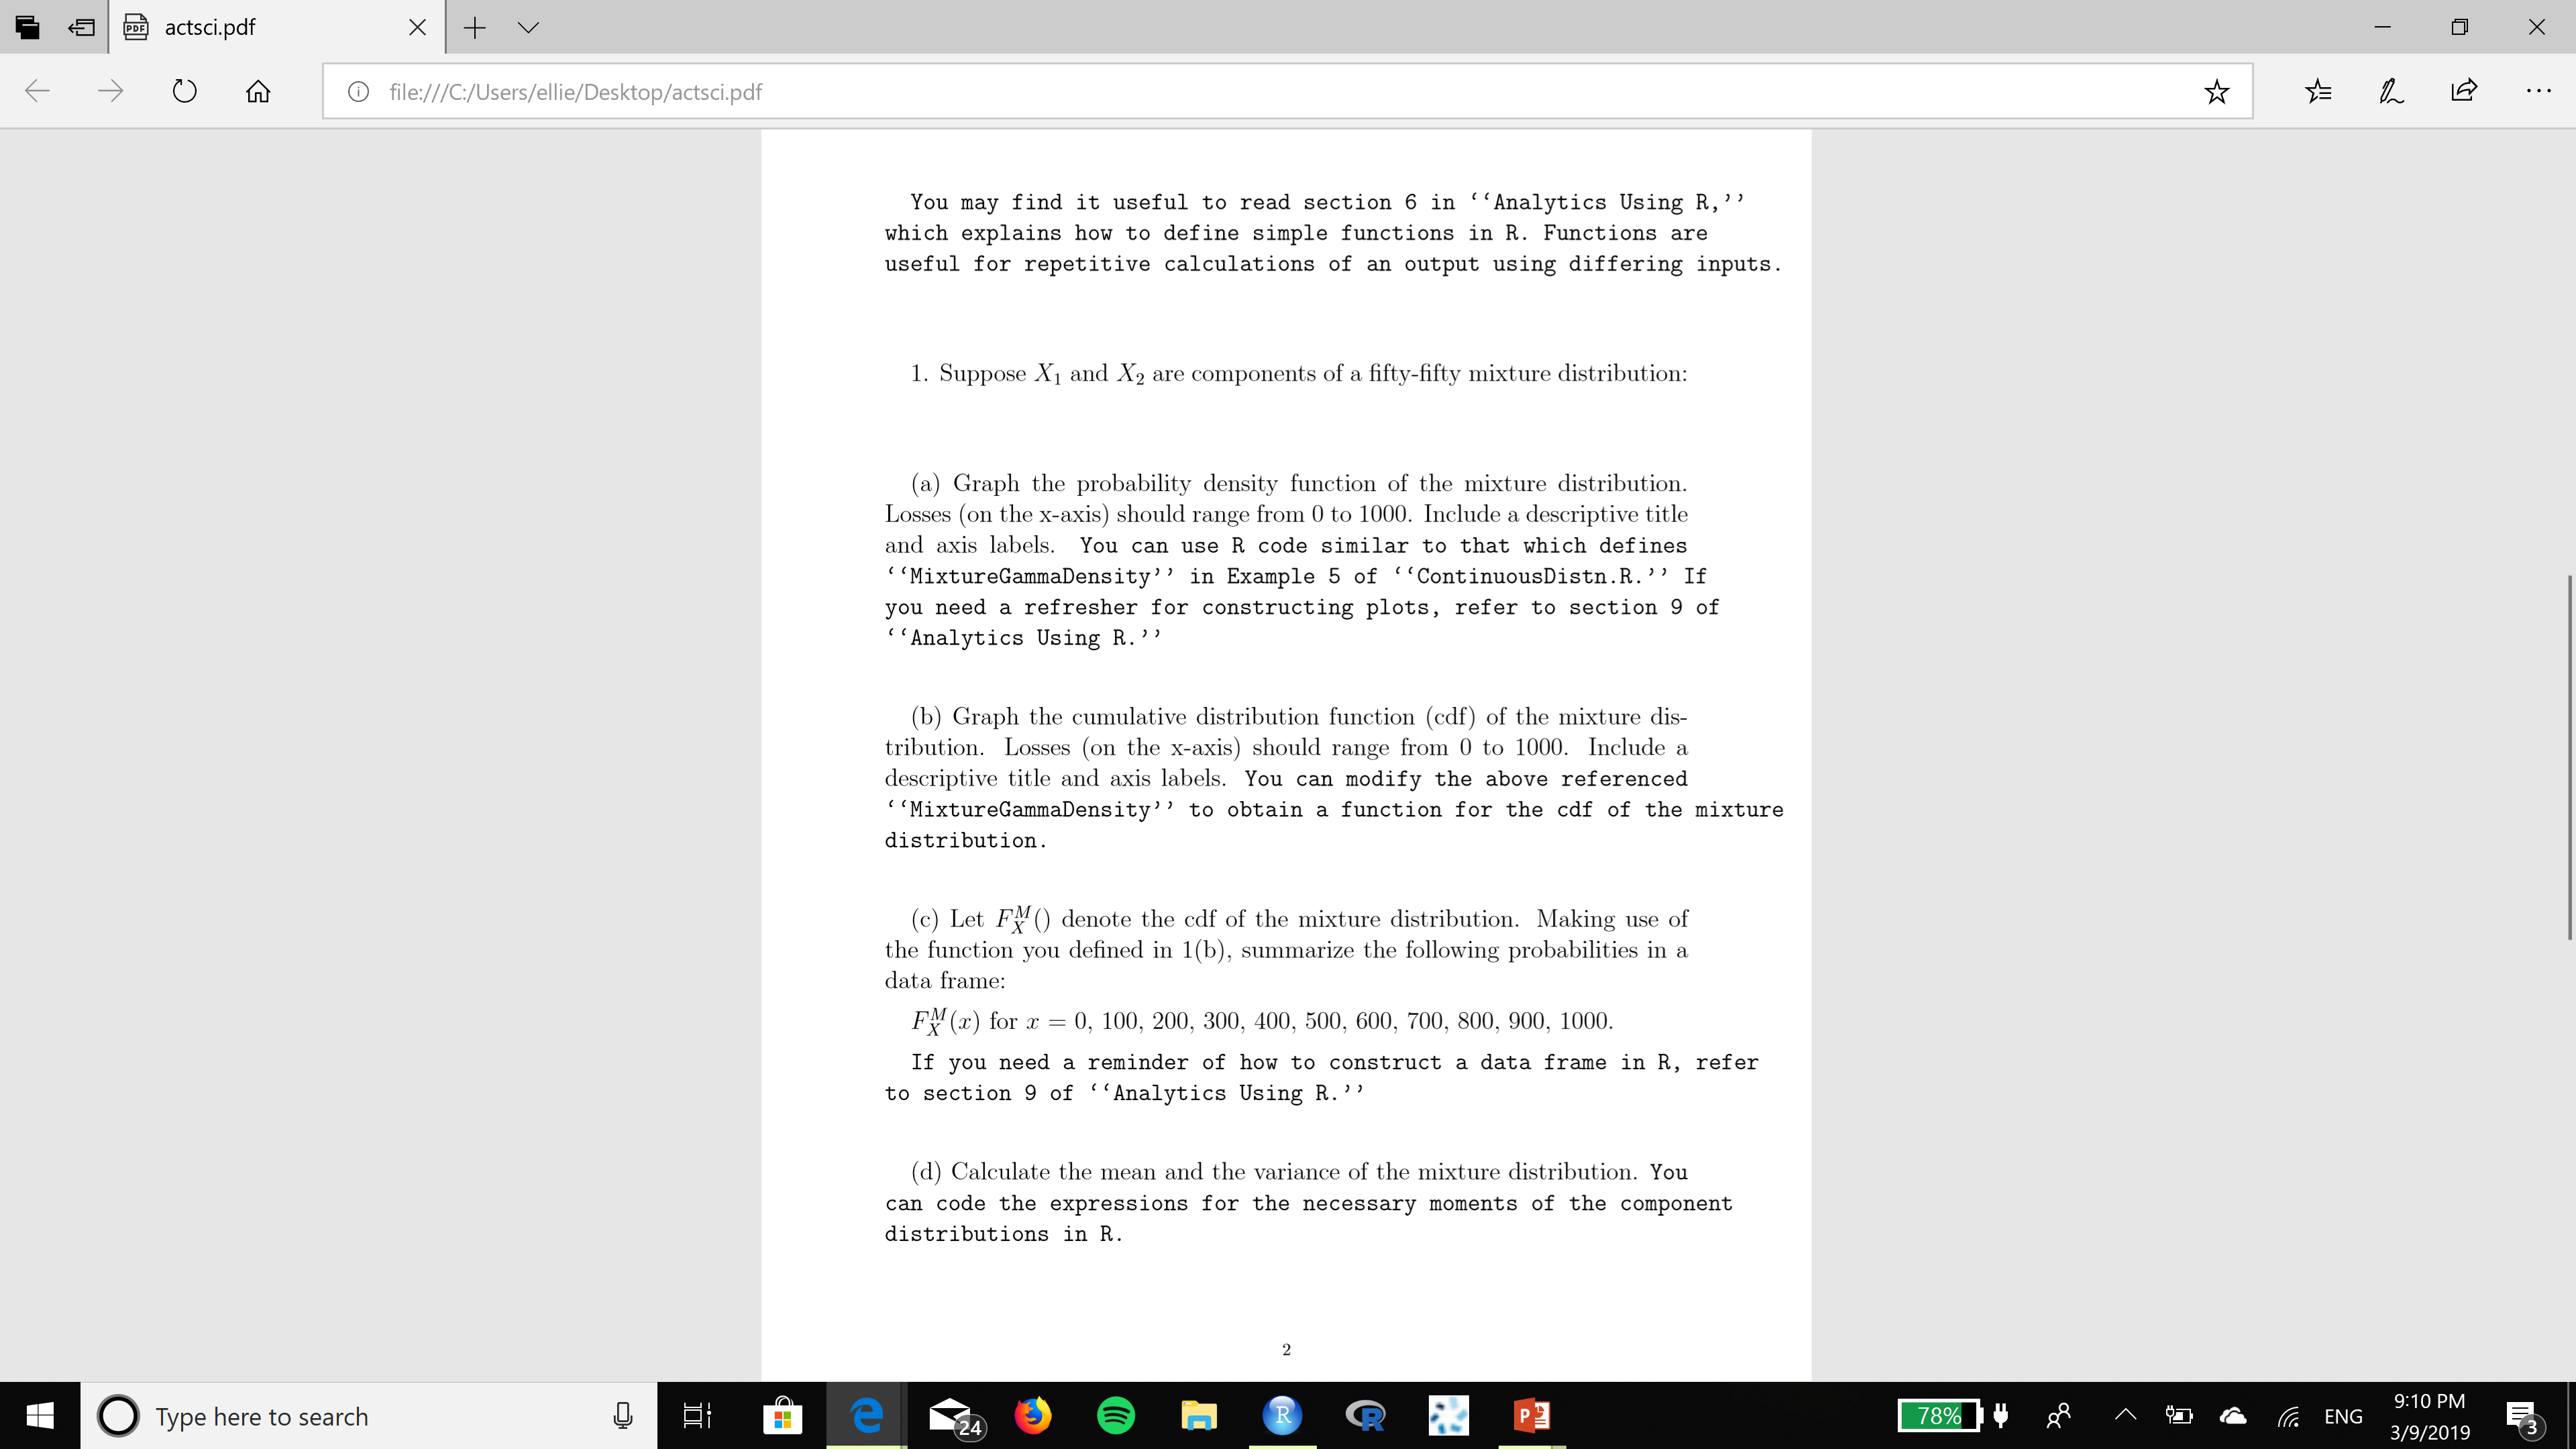
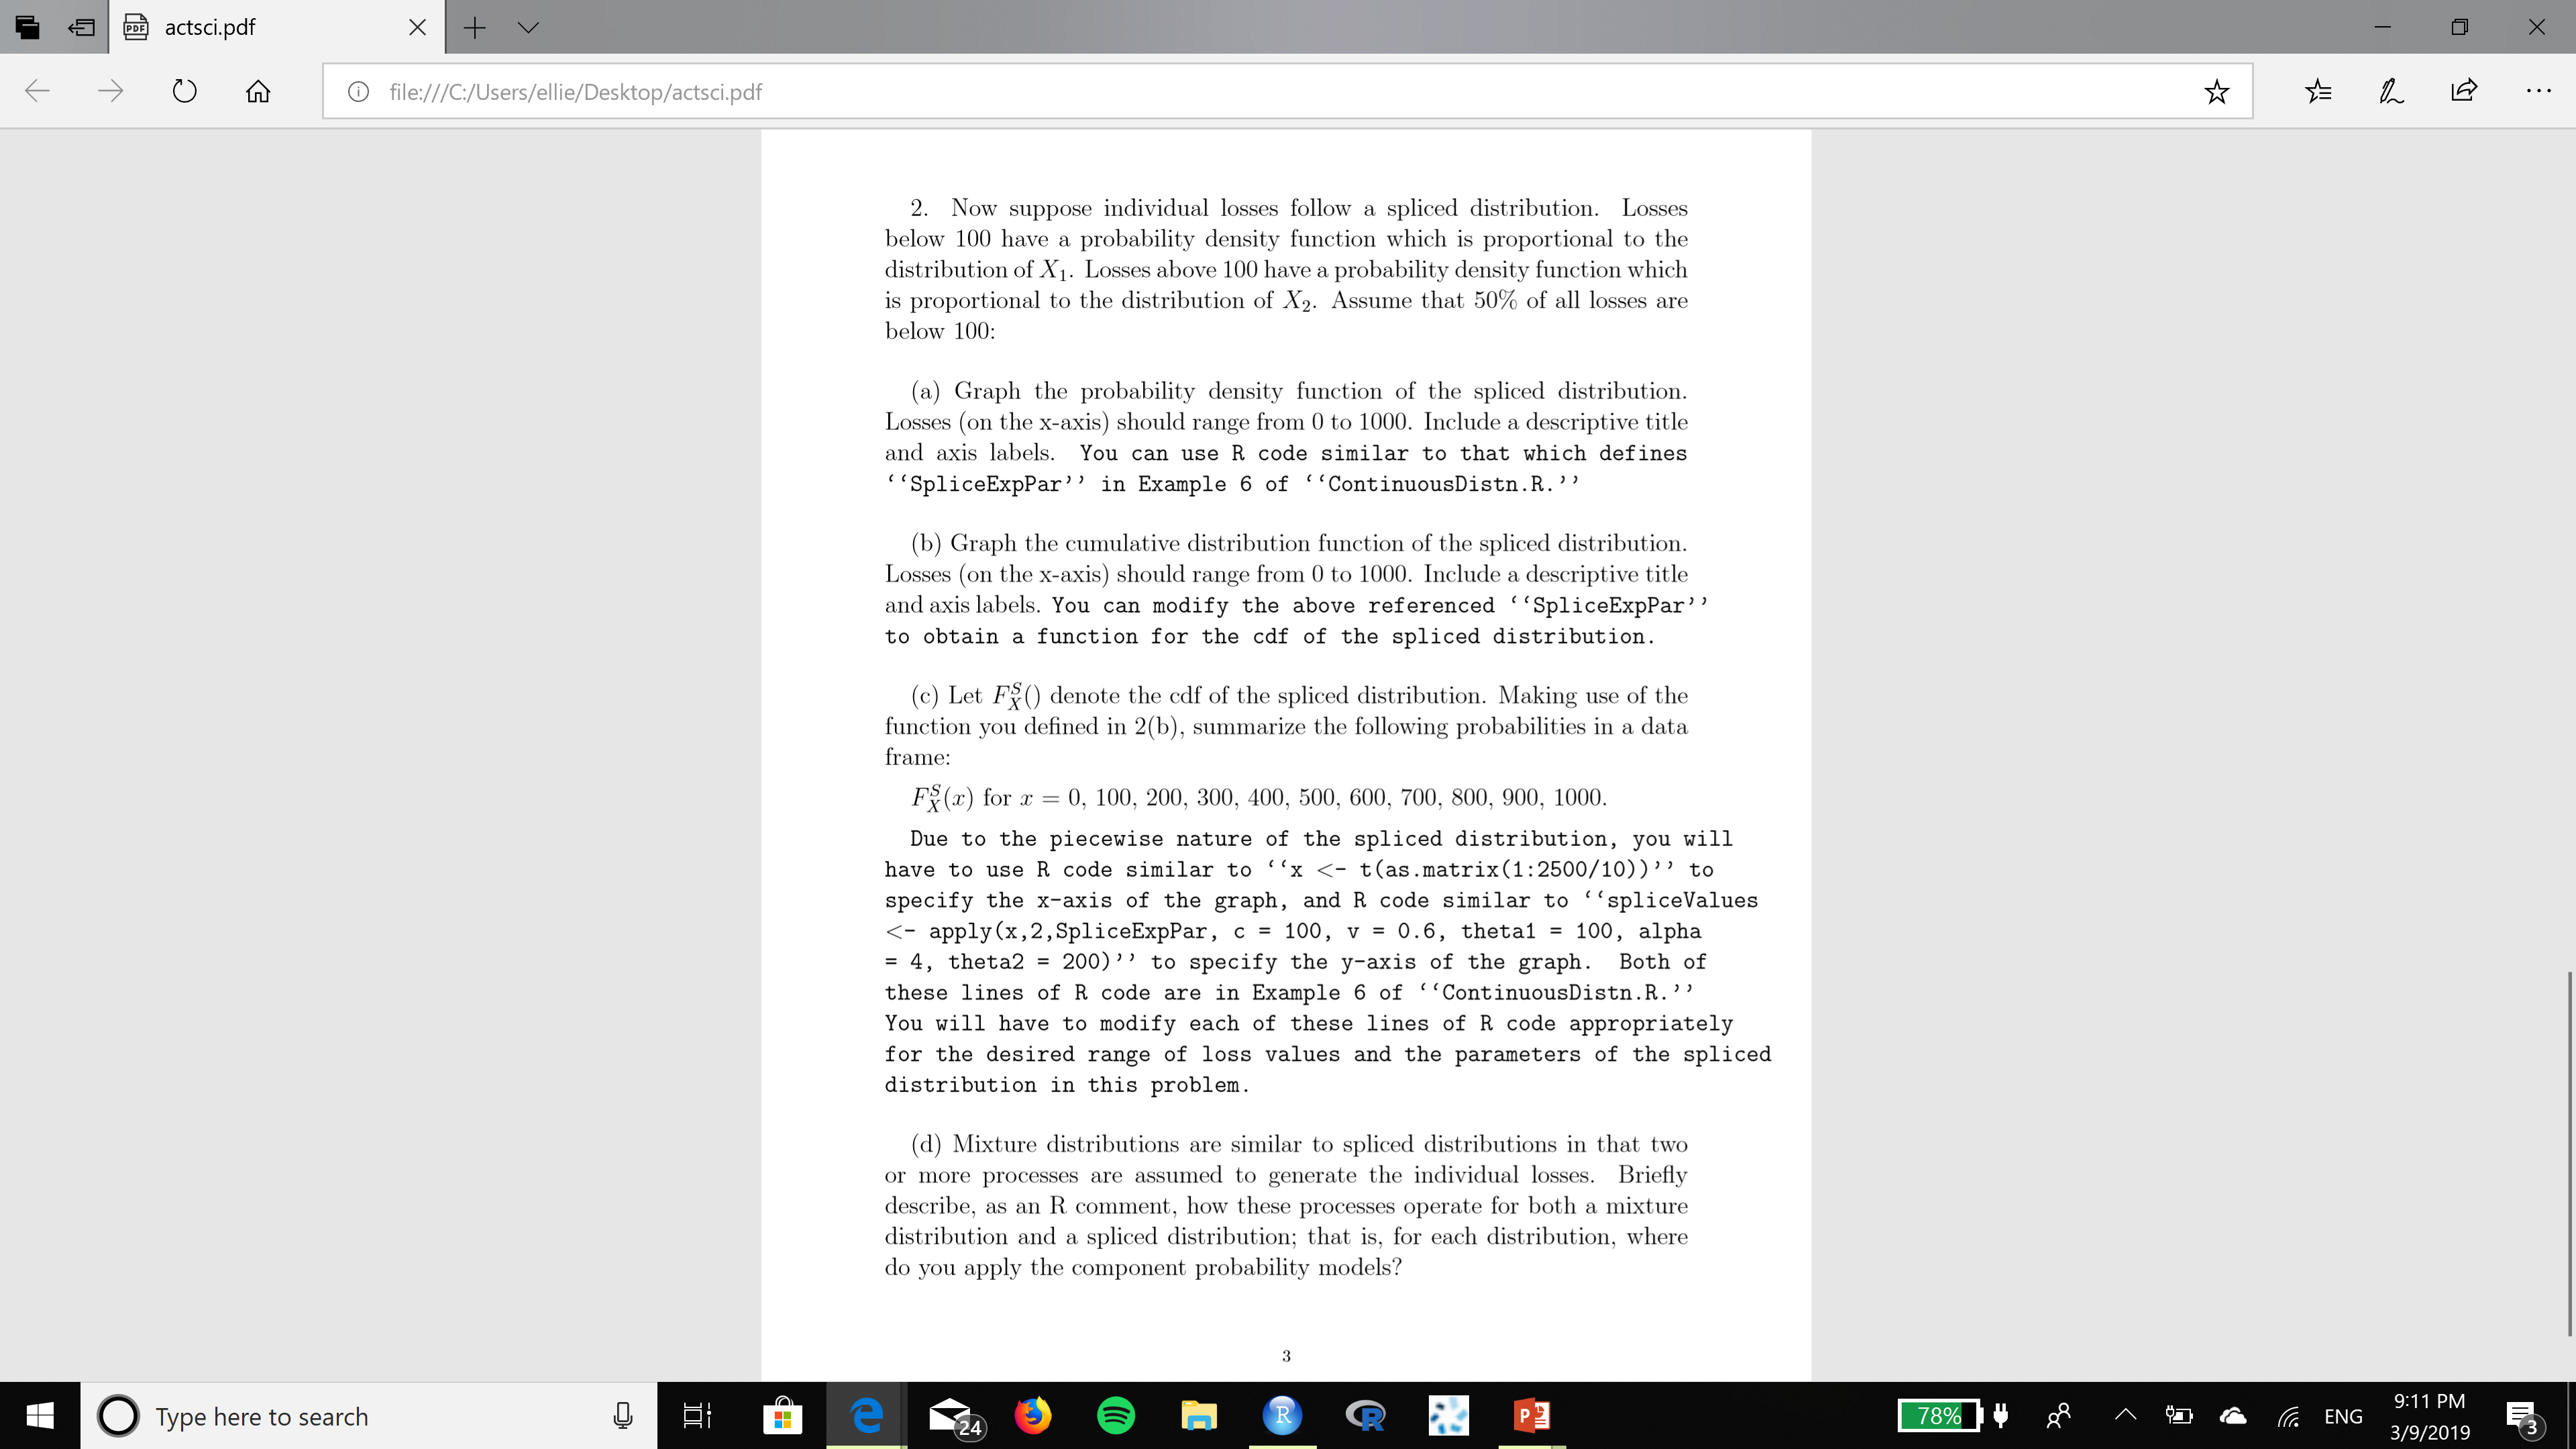
6 9 O m (D le:///C./Users/ellie/Desktop/actsclpdf it {a L I5; SUBMISSION GUIDELINES: All questions are to be done in R; please cutandpaste any relevant R code and output into a Microsoft Word le. Then, annotate the Word le, sometimes responding to questions asked in the homework. (Alternatively, you may wish to use \"R Markdown,\" a feature of R that will automatically allow you to document your code and produce pdf output in a single step.) You must show all work to receive full credit. Your completed assignment must be submitted to me via the Dropbox on the course website prior to the due date and time. Do NOT include your name in your submission, as this homework will be \"blind graded.\" Using the component distributions defined in Exercise, you will use R. to analyze both a mixture distribution and a spliced distribution. Exercise: Consider X1 and X2, Where: (i) X1 has a gamma distribution with a1 = 5 and 61 = 10, and (ii) X2 has a Pareto distribution with 012 = 3 and 62 = 600. Download and install the R packages \"actuar\" and \"VG-AM.\" Enter the following in R to limit the number of displayed signicant digits to four digits for subsequent calculations: options(scipen=999,digits=4). I (El @ actscipdf X + v 6 9 0 6h 0 file.///C./Users/ellie/Desktop/actscipdf You may find it useful to read section 6 in \"Analytics Using R,\" which explains how to define simple functions in a. Functions are useful for repetitive calculations of an output using differing inputs. 1. Suppose X] and X2 are components of s ftyfty xnixture distribution: (a) Graph the probability density function of the mixture distribution. Losses (on the x-axis) should range from 0 to 1000. Include a descriptive title and axis labels. You can use R code similar to that which defines \"MixtureGammaDensity\" in Example 5 of ' 'ContinuousDistn.R. ' ' If you need a refresher for constructing plots, refer to section 9 of \"Analytics Using R, ' ' (1)) Graph the cumulative distribution function (cdf) or the mixture die tribution. Losses (on the x-axis) should range from 0 to 1000. Include a descriptive title and axis labels. You can modify the above referenced \"MixtureGammaDensity\" to obtain a function for the cdf of the mixture distribution. (e) Let Fig\") denote the cdf of the mixture distribution. Makim7 use of the function you dened in 1(1)), summarize the following probabilities in a data frame: Ff/(z) for T. = U, 100, 200, 300, 400. 500. 600, 700, 800. 900, 1000. If you need a reminder of how to construct a data frame in R, refer to section 9 of \"Analytics Using R. \" (d) Calculate the mean ftnd the variance of the mixture distribution. You can code the expressions for the necessary moments of the component distributions in R. 6 9 O m (D le:///C./User5/ellie/Desktop/actsclpdf it {a L I5; 2. Now suppose individual losses follow a spliced distribution. Losses below 100 have a probability density function which is proportional to the distribution of X1. Losses above 100 have a probability density function which is proportional to the distribution of X2. Assume that 50% of all losses are below 100: (a) Graph the probability density function of the spliced distribution. Losses (on the x-axis) should range from 0 to 1000, Include a descriptive title and axis labels. You can use R code similar to that which defines \"SpliceExpPar\" in Example 6 of \"ContinuousDistniRi \" (b) Graph the cumulative distribution function of the spliced distribution. Losses (on the xaxis) should range from 0 to 1000. Include a descriptive title and axis labels. You can modify the above referenced ' ' SpliceExpPar' ' to obtain a function for the cdf of the spliced distribution. (c) Let F() denote the cdf of the spliced distribution. Making use of the function you dened in 2(o), summarize the following probabilities in a data frame: Fz) for 1' = 0, 100, 200, 300, 400, 500, 600, 700, 800, 900, 1000. Due to the piecewise nature of the spliced distribution, you will have to use R code similar to \"x


