Question
6 A firm carrying out opinion polls is checking whether the age distribution of its respondents reflects that of the general population. It has


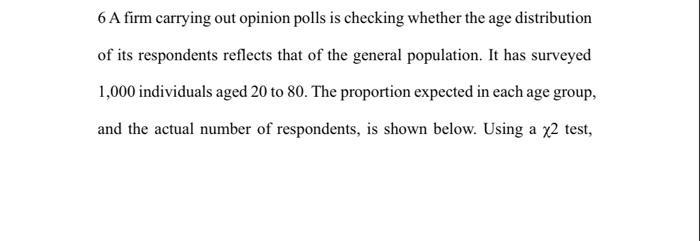
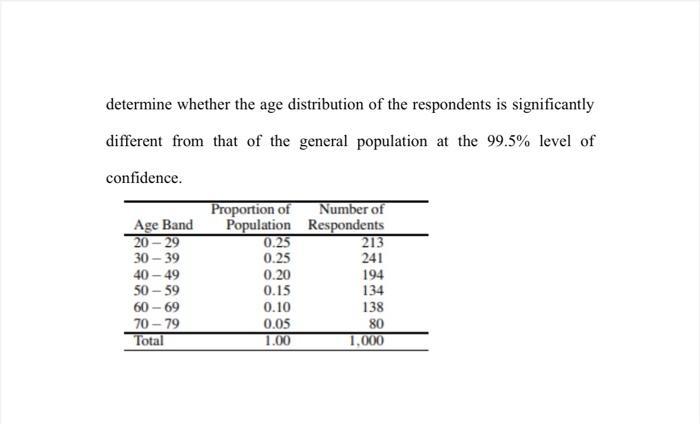
6 A firm carrying out opinion polls is checking whether the age distribution of its respondents reflects that of the general population. It has surveyed 1,000 individuals aged 20 to 80. The proportion expected in each age group, and the actual number of respondents, is shown below. Using a x2 test, determine whether the age distribution of the respondents is significantly different from that of the general population at the 99.5% level of confidence. Proportion of Number of Age Band Population Respondents 20-29 0.25 213 30-39 0.25 241 40-49 0.20 194 50-59 0.15 134 60-69 0.10 138 70-79 0.05 80 Total 1.00 1,000
Step by Step Solution
There are 3 Steps involved in it
Step: 1

Get Instant Access to Expert-Tailored Solutions
See step-by-step solutions with expert insights and AI powered tools for academic success
Step: 2

Step: 3

Ace Your Homework with AI
Get the answers you need in no time with our AI-driven, step-by-step assistance
Get StartedRecommended Textbook for
Development Economics
Authors: Gérard Roland
1st Edition
0321464486, 9780321464484
Students also viewed these Finance questions
Question
Answered: 1 week ago
Question
Answered: 1 week ago
Question
Answered: 1 week ago
Question
Answered: 1 week ago
Question
Answered: 1 week ago
Question
Answered: 1 week ago
Question
Answered: 1 week ago
Question
Answered: 1 week ago
Question
Answered: 1 week ago
Question
Answered: 1 week ago
Question
Answered: 1 week ago
Question
Answered: 1 week ago
Question
Answered: 1 week ago
Question
Answered: 1 week ago
Question
Answered: 1 week ago
Question
Answered: 1 week ago
Question
Answered: 1 week ago
Question
Answered: 1 week ago
Question
Answered: 1 week ago
Question
Answered: 1 week ago
Question
Answered: 1 week ago
View Answer in SolutionInn App


