Answered step by step
Verified Expert Solution
Question
1 Approved Answer
6. a) What kind of visual graph is Figure 4 (next page)? (1 point) b) Describe the overall/long-term and cyclical trends you observe in

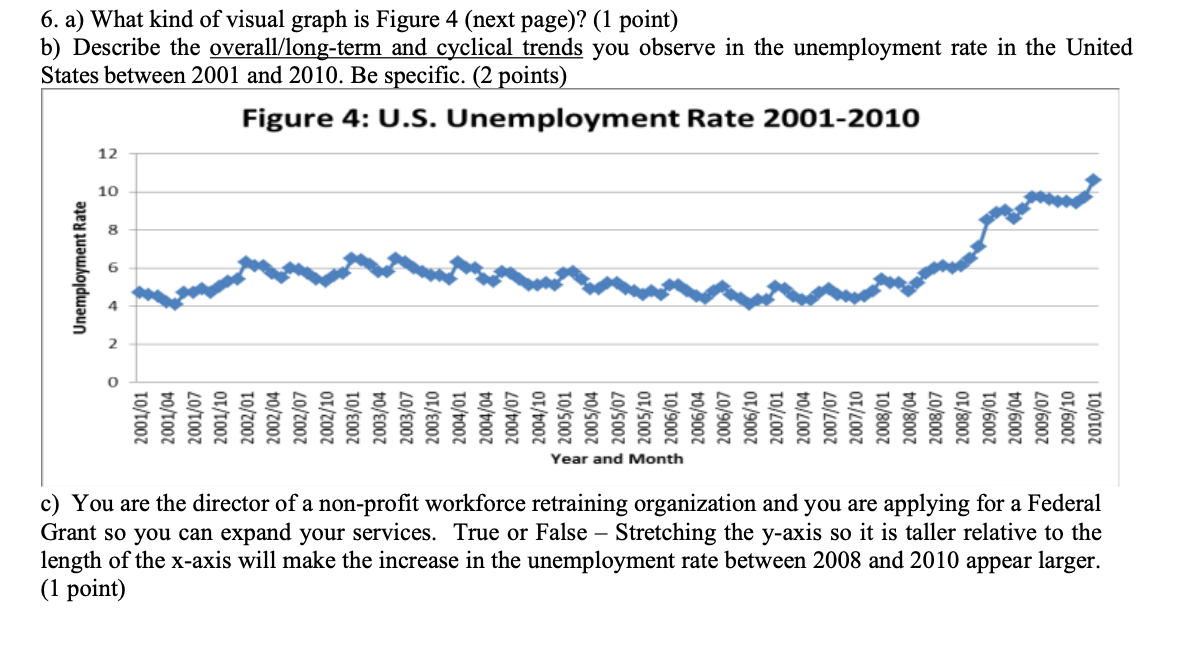
6. a) What kind of visual graph is Figure 4 (next page)? (1 point) b) Describe the overall/long-term and cyclical trends you observe in the unemployment rate in the United States between 2001 and 2010. Be specific. (2 points) Figure 4: U.S. Unemployment Rate 2001-2010 Unemployment Rate 12 10 006020 8 4 2001/01 2001/04 2001/07 2001/10 2002/01 2002/04 2002/07 2002/10 2003/01 2003/04 2003/07 2003/10 2004/01 2004/04 2004/07 2004/10 2005/01 2005/04 2005/07 2005/10 2006/01 Year and Month 2006/04 2006/07 2006/10 TO/2007 2007/04 2007/07 2007/10 2008/01 2008/04 2008/07 2008/10 TO/600Z 2009/04 2009/07 2009/10 2010/01 c) You are the director of a non-profit workforce retraining organization and you are applying for a Federal Grant so you can expand your services. True or False - Stretching the y-axis so it is taller relative to the length of the x-axis will make the increase in the unemployment rate between 2008 and 2010 appear larger. (1 point)
Step by Step Solution
★★★★★
3.36 Rating (152 Votes )
There are 3 Steps involved in it
Step: 1
a Figure 4 is a line graph b The overall longterm trend in the unemploymen...
Get Instant Access to Expert-Tailored Solutions
See step-by-step solutions with expert insights and AI powered tools for academic success
Step: 2

Step: 3

Ace Your Homework with AI
Get the answers you need in no time with our AI-driven, step-by-step assistance
Get Started


