

Answered step by step
Verified Expert Solution
Question
1 Approved Answer
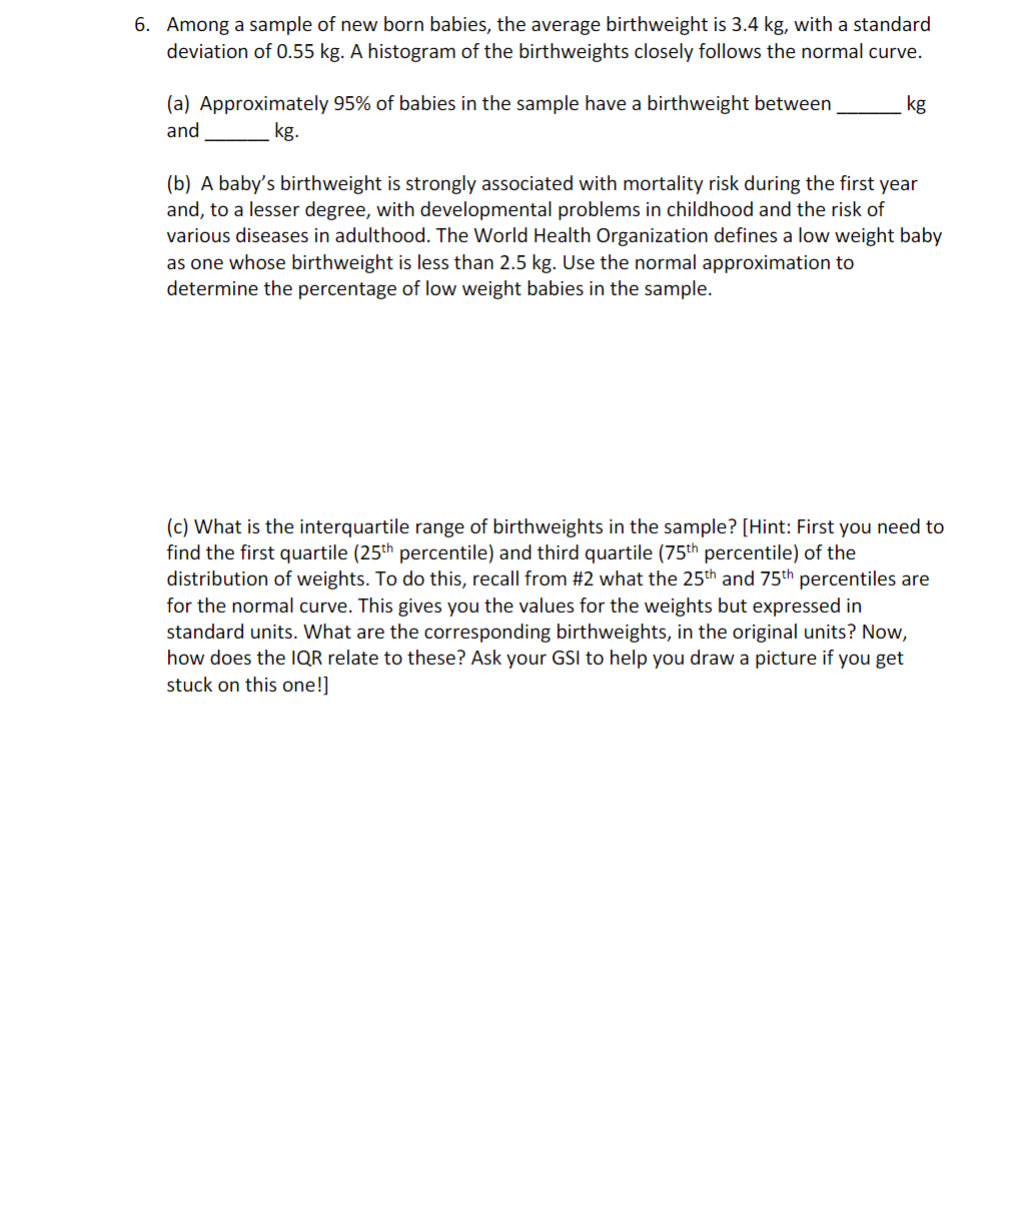
6. Among a sample of new born babies, the average birthweight is 3.4 kg, with a standard deviation of 0.55 kg. A histogram of the
Step by Step Solution
There are 3 Steps involved in it
Step: 1

Get Instant Access to Expert-Tailored Solutions
See step-by-step solutions with expert insights and AI powered tools for academic success
Step: 2

Step: 3
Ace Your Homework with AI
Get the answers you need in no time with our AI-driven, step-by-step assistance
Get Started
WebAssign For Trigonometry
Authors: James Stewart
2nd Edition
1337772313, 9781337772310