Question
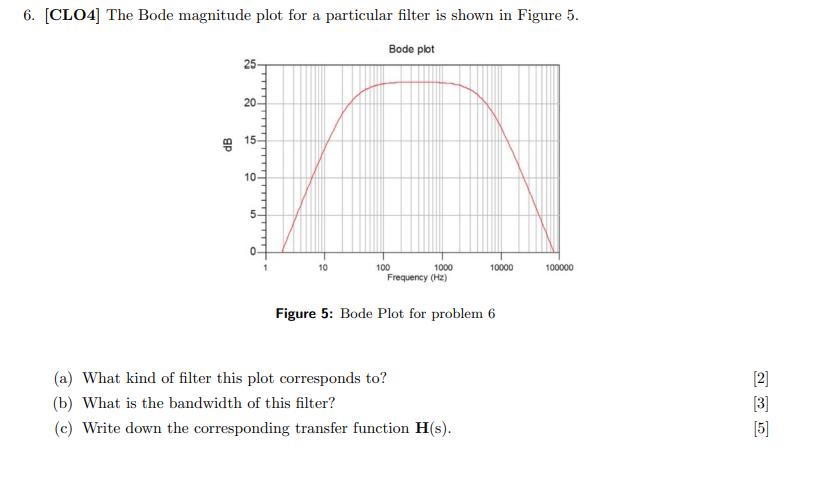
6. [CLO4] The Bode magnitude plot for a particular filter is shown in Figure 5. Bode plot 25 20 15 10 5. 10 100

6. [CLO4] The Bode magnitude plot for a particular filter is shown in Figure 5. Bode plot 25 20 15 10 5. 10 100 1000 10000 100000 Frequency (Hz) Figure 5: Bode Plot for problem 6 (a) What kind of filter this plot corresponds to? [2] (b) What is the bandwidth of this filter? [3] (c) Write down the corresponding transfer function H(s). [5] dB
Step by Step Solution
3.21 Rating (151 Votes )
There are 3 Steps involved in it
Step: 1

Get Instant Access to Expert-Tailored Solutions
See step-by-step solutions with expert insights and AI powered tools for academic success
Step: 2

Step: 3

Ace Your Homework with AI
Get the answers you need in no time with our AI-driven, step-by-step assistance
Get StartedRecommended Textbook for
Modern Control Systems
Authors: Richard C. Dorf, Robert H. Bishop
12th edition
136024580, 978-0136024583
Students also viewed these Electrical Engineering questions
Question
Answered: 1 week ago
Question
Answered: 1 week ago
Question
Answered: 1 week ago
Question
Answered: 1 week ago
Question
Answered: 1 week ago
Question
Answered: 1 week ago
Question
Answered: 1 week ago
Question
Answered: 1 week ago
Question
Answered: 1 week ago
Question
Answered: 1 week ago
Question
Answered: 1 week ago
Question
Answered: 1 week ago
Question
Answered: 1 week ago
Question
Answered: 1 week ago
Question
Answered: 1 week ago
Question
Answered: 1 week ago
Question
Answered: 1 week ago
Question
Answered: 1 week ago
Question
Answered: 1 week ago
Question
Answered: 1 week ago
Question
Answered: 1 week ago
Question
Answered: 1 week ago
View Answer in SolutionInn App


