Answered step by step
Verified Expert Solution
Link Copied!

Question

1 Approved Answer

6. Consider the following information for Stocks 1 and 2: Expected Standard Stock Return Deviation 1 20% 40% 2 12% 20% NE a. The correlation
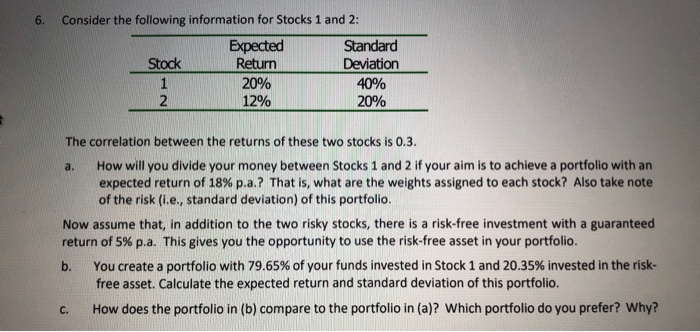
image text in transcribed
6. Consider the following information for Stocks 1 and 2: Expected Standard Stock Return Deviation 1 20% 40% 2 12% 20% NE a. The correlation between the returns of these two stocks is 0.3. How will you divide your money between Stocks 1 and 2 if your aim is to achieve a portfolio with an expected return of 18% p.a.? That is, what are the weights assigned to each stock? Also take note of the risk (i.e., standard deviation) of this portfolio. Now assume that, in addition to the two risky stocks, there is a risk-free investment with a guaranteed return of 5% p.a. This gives you the opportunity to use the risk-free asset in your portfolio. b. You create a portfolio with 79.65% of your funds invested in Stock 1 and 20.35% invested in the risk- free asset. Calculate the expected return and standard deviation of this portfolio. How does the portfolio in (b) compare to the portfolio in (a)? Which portfolio do you prefer? Why? C

Step by Step Solution

There are 3 Steps involved in it

Step: 1

blur-text-image

Get Instant Access to Expert-Tailored Solutions

See step-by-step solutions with expert insights and AI powered tools for academic success

Step: 2

blur-text-image_2

Step: 3

blur-text-image_3

Ace Your Homework with AI

Get the answers you need in no time with our AI-driven, step-by-step assistance

Get Started

Recommended Textbook for

Succeeding in Business with Microsoft Excel 2013 A Problem Solving Approach

Authors: Debra Gross, Frank Akaiwa, Karleen Nordquist

1st edition

978-1285099149, 9781285963969, 1285099141, 1285963962, 978-1285715346

More Books

Students also viewed these Finance questions

Question

When did unions grow the fastest? Why?

Answered: 1 week ago

Question

=+b. Which city has an absolute advantage in the

Answered: 1 week ago